fal-ai/sensenova-u1-infographic
Generate Infographic Image with Sensenova U1
Inference
Commercial use
Input
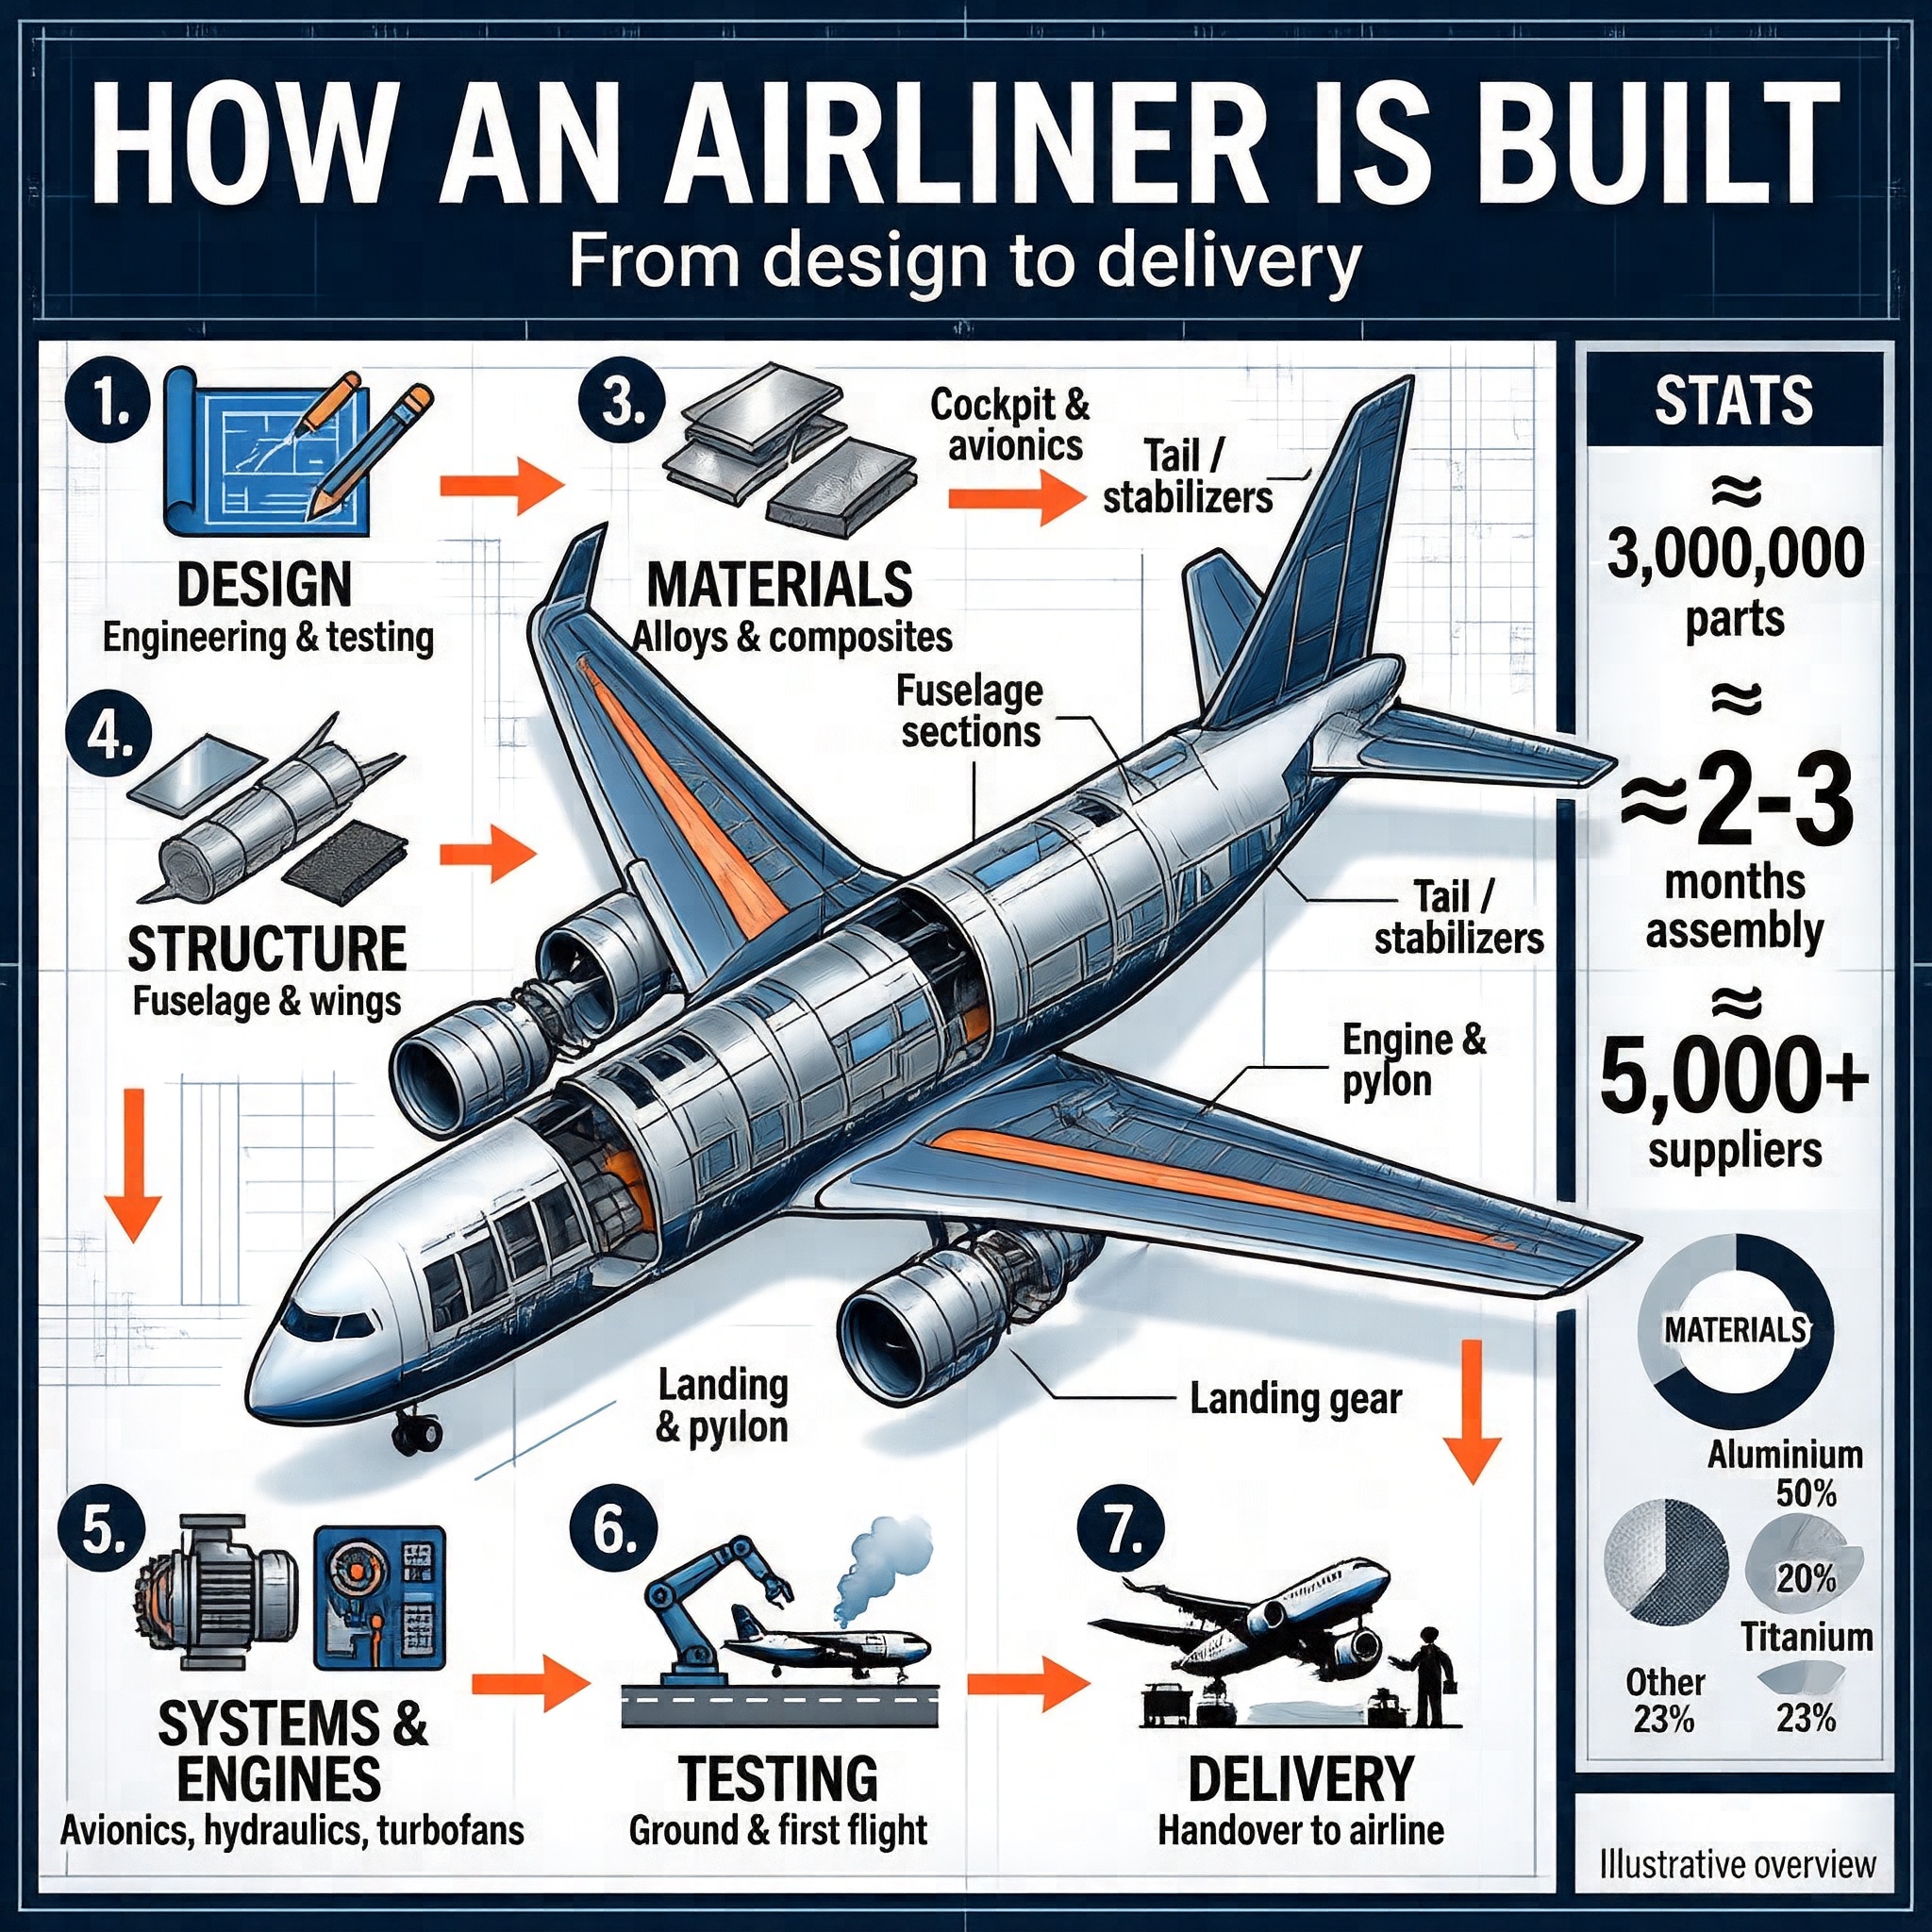
Create a premium editorial-technical INFOGRAPHIC POSTER on how a commercial airliner is built, from design to delivery. Portrait poster format (4:5). Clean modern aerospace style — engineering blueprint meets high-end magazine infographic. Crisp, perfectly legible English text, correct spelling, strong hierarchy, generous spacing, minimal clutter.
COLOR PALETTE: deep aerospace navy and steel blue, light gray and white panels, bright orange-red accent for numbers and arrows. Subtle blueprint grid in the background.
TYPOGRAPHY: clean geometric sans-serif — large bold title, medium headings, small labels. Numbered circular badges.
HEADER:
- Title (very large, bold): "HOW AN AIRLINER IS BUILT"
- Subtitle: "From design to delivery"
CENTER: a large isometric cutaway / exploded-view illustration of a modern twin-engine commercial jet, components slightly separated, labeled with thin leader lines:
"Cockpit & avionics", "Fuselage sections", "Wing & fuel tanks", "Tail / stabilizers", "Engine & pylon", "Landing gear".
PROCESS FLOW: 7 numbered steps connected by orange arrows, each with a small flat icon, a bold heading and a 2-3 word caption:
1. DESIGN — "Engineering & testing"
2. MATERIALS — "Alloys & composites"
3. STRUCTURE — "Fuselage & wings"
4. FINAL ASSEMBLY — "Sections joined"
5. SYSTEMS & ENGINES — "Avionics, hydraulics, turbofans"
6. TESTING — "Ground & first flight"
7. DELIVERY — "Handover to airline"
SIDE STAT PANEL (bold numbers + tiny labels):
- "≈ 3,000,000 parts"
- "≈ 2-3 months assembly"
- "≈ 5,000+ suppliers"
SMALL "MATERIALS" donut chart: "Aluminium 50%", "Composites 20%", "Titanium 7%", "Other 23%".
FOOTER (small): "Illustrative overview".
STYLE NOTES: vector-clean icons, thin leader lines, every label sharp and readable, lots of negative space, ultra-high resolution, premium infographic look.
Additional Settings
Customize your input with more control.
Result
Idle
What would you like to do next?
{
  "images": [
    {
      "url": "https://v3b.fal.media/files/b/0a9eb75b/TLTi9hdYAyrdHjXMVRYVH.jpg",
      "width": 2048,
      "height": 2048,
      "content_type": "image/jpeg"
    }
  ],
  "seed": 1039691000,
  "has_nsfw_concepts": [
    false
  ],
  "prompt": "Create a premium editorial-technical INFOGRAPHIC POSTER on how a commercial airliner is built, from design to delivery. Portrait poster format (4:5). Clean modern aerospace style — engineering blueprint meets high-end magazine infographic. Crisp, perfectly legible English text, correct spelling, strong hierarchy, generous spacing, minimal clutter.\n\nCOLOR PALETTE: deep aerospace navy and steel blue, light gray and white panels, bright orange-red accent for numbers and arrows. Subtle blueprint grid in the background.\n\nTYPOGRAPHY: clean geometric sans-serif — large bold title, medium headings, small labels. Numbered circular badges.\n\nHEADER:\n- Title (very large, bold): \"HOW AN AIRLINER IS BUILT\"\n- Subtitle: \"From design to delivery\"\n\nCENTER: a large isometric cutaway / exploded-view illustration of a modern twin-engine commercial jet, components slightly separated, labeled with thin leader lines:\n\"Cockpit & avionics\", \"Fuselage sections\", \"Wing & fuel tanks\", \"Tail / stabilizers\", \"Engine & pylon\", \"Landing gear\".\n\nPROCESS FLOW: 7 numbered steps connected by orange arrows, each with a small flat icon, a bold heading and a 2-3 word caption:\n1. DESIGN — \"Engineering & testing\"\n2. MATERIALS — \"Alloys & composites\"\n3. STRUCTURE — \"Fuselage & wings\"\n4. FINAL ASSEMBLY — \"Sections joined\"\n5. SYSTEMS & ENGINES — \"Avionics, hydraulics, turbofans\"\n6. TESTING — \"Ground & first flight\"\n7. DELIVERY — \"Handover to airline\"\n\nSIDE STAT PANEL (bold numbers + tiny labels):\n- \"≈ 3,000,000 parts\"\n- \"≈ 2-3 months assembly\"\n- \"≈ 5,000+ suppliers\"\n\nSMALL \"MATERIALS\" donut chart: \"Aluminium 50%\", \"Composites 20%\", \"Titanium 7%\", \"Other 23%\".\n\nFOOTER (small): \"Illustrative overview\".\n\nSTYLE NOTES: vector-clean icons, thin leader lines, every label sharp and readable, lots of negative space, ultra-high resolution, premium infographic look.",
  "thinking": "1. **Instruction Understanding:**\nCreate a vertical infographic poster detailing airliner construction with specific text, layout, and color requirements.\n\n2. **Reasoning Process:**\nThe prompt implies a need for high legibility and structured information hierarchy to effectively communicate complex engineering data.\n\n3. **Establish the frame:**\nThe portrait 4:5 format centers the isometric jet with surrounding process steps and side statistics.\n\n4. **Set the lighting and color:**\nDeep navy and steel blue tones dominate with bright orange-red accents for numbers and arrows.\n\n5. **Lock the style:**\nThe aesthetic combines engineering blueprint precision with high-end magazine infographic clarity.\n\n6. **Explicit Prompt:**\nThe infographic titled \"HOW AN AIRLINER IS BUILT\" with the subtitle \"From design to delivery\" presents a comprehensive, visually structured overview of the aircraft manufacturing process. The layout is vertical and portrait-oriented, designed as a poster with a clean, modern aesthetic combining technical blueprint elements with high-end magazine-style typography and iconography. The color palette features deep navy and steel blue tones, accented with bright orange-red for numbers and arrows, set against light gray and white panels for contrast and readability.\n\nAt the center of the composition is a large, detailed isometric cutaway illustration of a modern twin-engine commercial jet, shown in an exploded or partially disassembled view to reveal internal components. This central image is labeled with thin leader lines pointing to specific parts: \"Cockpit & avionics\", \"Fuselage sections\", \"Wing & fuel tanks\", \"Tail / stabilizers\", \"Engine & pylon\", and \"Landing gear\". The aircraft is rendered in a sleek, metallic finish with visible panel lines and structural details, emphasizing engineering precision.\n\nSurrounding the central aircraft are seven numbered steps in the manufacturing process, arranged in a clockwise flow from top-left to bottom-right, connected by orange arrows indicating progression. Each step includes a small, flat-style icon, a bold heading, and a brief descriptive caption:\n\n1. **DESIGN** – Icon: blueprint with pencil. Caption: \"Engineering & testing\"\n2. **MATERIALS** – Icon: metal sheet and composite material. Caption: \"Alloys & composites\"\n3. **STRUCTURE** – Icon: fuselage cross-section. Caption: \"Fuselage & wings\"\n4. **FINAL ASSEMBLY** – Icon: robotic arm assembling parts. Caption: \"Sections joined\"\n5. **SYSTEMS & ENGINES** – Icon: engine and control panel. Caption: \"Avionics, hydraulics, turbofans\"\n6. **TESTING** – Icon: airplane on runway with smoke. Caption: \"Ground & first flight\"\n7. **DELIVERY** – Icon: airplane on tarmac with ground crew. Caption: \"Handover to airline\"\n\nTo the right of the central aircraft, a vertical panel labeled \"STATS\" provides key data points in large, bold numerals with accompanying text:\n\n- ≈ 3,000,000 parts\n- ≈ 2-3 months assembly\n- ≈ 5,000+ suppliers\n\nBelow this, a circular donut chart labeled \"MATERIALS\" breaks down the composition of materials used:\n\n- Aluminum 50%\n- Composites 20%\n- Titanium 7%\n- Other 23%\n\nThe overall style blends technical accuracy with editorial design, using a grid background reminiscent of engineering blueprints, crisp sans-serif fonts, and minimalistic icons. The visual hierarchy is clear, with the title in large, bold type at the top, followed by the central image, then the process flow, and finally the statistics and material breakdown. The footer contains the text \"Illustrative overview\" in small print, indicating that the content is representative rather than exhaustive.\n\nAll textual content is in English, and the infographic uses a combination of direct labeling, icons, and numerical data to convey information efficiently. The design emphasizes clarity, precision, and a premium, professional tone suitable for an educational or promotional context.\n</think>",
  "timings": {
    "generation": 145.22897322599965
  }
}
Your request will cost $0.05 per generated image. Enabling thinking mode applies a 1.2x multiplier, so a request with thinking mode will cost $0.06 per image.