> ## Documentation Index
> Fetch the complete documentation index at: https://fal.ai/docs/llms.txt
> Use this file to discover all available pages before exploring further.

# Product Changelog

> Latest features and updates to the fal platform

<div className="max-w-2xl mx-auto bg-gradient-to-br from-blue-600/10 to-blue-500/5 border border-blue-500/20 rounded-xl p-5 mb-8 shadow-sm">
  <div className="flex items-center gap-2.5 mb-4">
    <div className="w-8 h-8 rounded-lg bg-blue-500/15 flex items-center justify-center">
      <svg width="14" height="14" viewBox="0 0 24 24" fill="#3386FE" xmlns="http://www.w3.org/2000/svg">
        <path d="M8 5.14v14.72a1 1 0 001.5.86l11-7.36a1 1 0 000-1.72l-11-7.36a1 1 0 00-1.5.86z" />
      </svg>
    </div>

    <div>
      <span className="font-semibold text-blue-700 dark:text-blue-400">
        What's New in Serverless
      </span>

      <span className="text-sm text-gray-500 dark:text-gray-400 ml-2">
        Scaling, observability, cold starts, multi-GPU & more
      </span>
    </div>
  </div>

  <iframe className="w-full aspect-video rounded-lg" srcdoc="<style>*{padding:0;margin:0;overflow:hidden}html,body{height:100%}img,span{position:absolute;width:100%;top:0;bottom:0;margin:auto}span{height:1.5em;text-align:center;font:48px/1.5 sans-serif;color:white;text-shadow:0 0 0.5em black}</style><a href='https://www.youtube.com/embed/gDJJ9bppyV8?autoplay=1'><img src='https://img.youtube.com/vi/gDJJ9bppyV8/maxresdefault.jpg' alt='What's New in fal Serverless'><span>▶</span></a>" frameborder="0" allow="accelerometer; autoplay; clipboard-write; encrypted-media; gyroscope; picture-in-picture; web-share" allowfullscreen />
</div>

<Update label="April 29, 2026" tags={["Dashboard", "Analytics", "Serverless"]}>
  ## Aggregate Analytics Components

  <Frame>
    <img src="https://mintcdn.com/fal-d8505a2e/NH1xMgqfuYMzBqdq/images/changelog/apps.png?fit=max&auto=format&n=NH1xMgqfuYMzBqdq&q=85&s=39b65eb1b8d4b4f4d0376c0a11b57a05" alt="Serverless apps page showing shared health metrics components for runners, requests, latency, errors, and queue" className="w-full rounded-lg" width="5504" height="3128" data-path="images/changelog/apps.png" />
  </Frame>

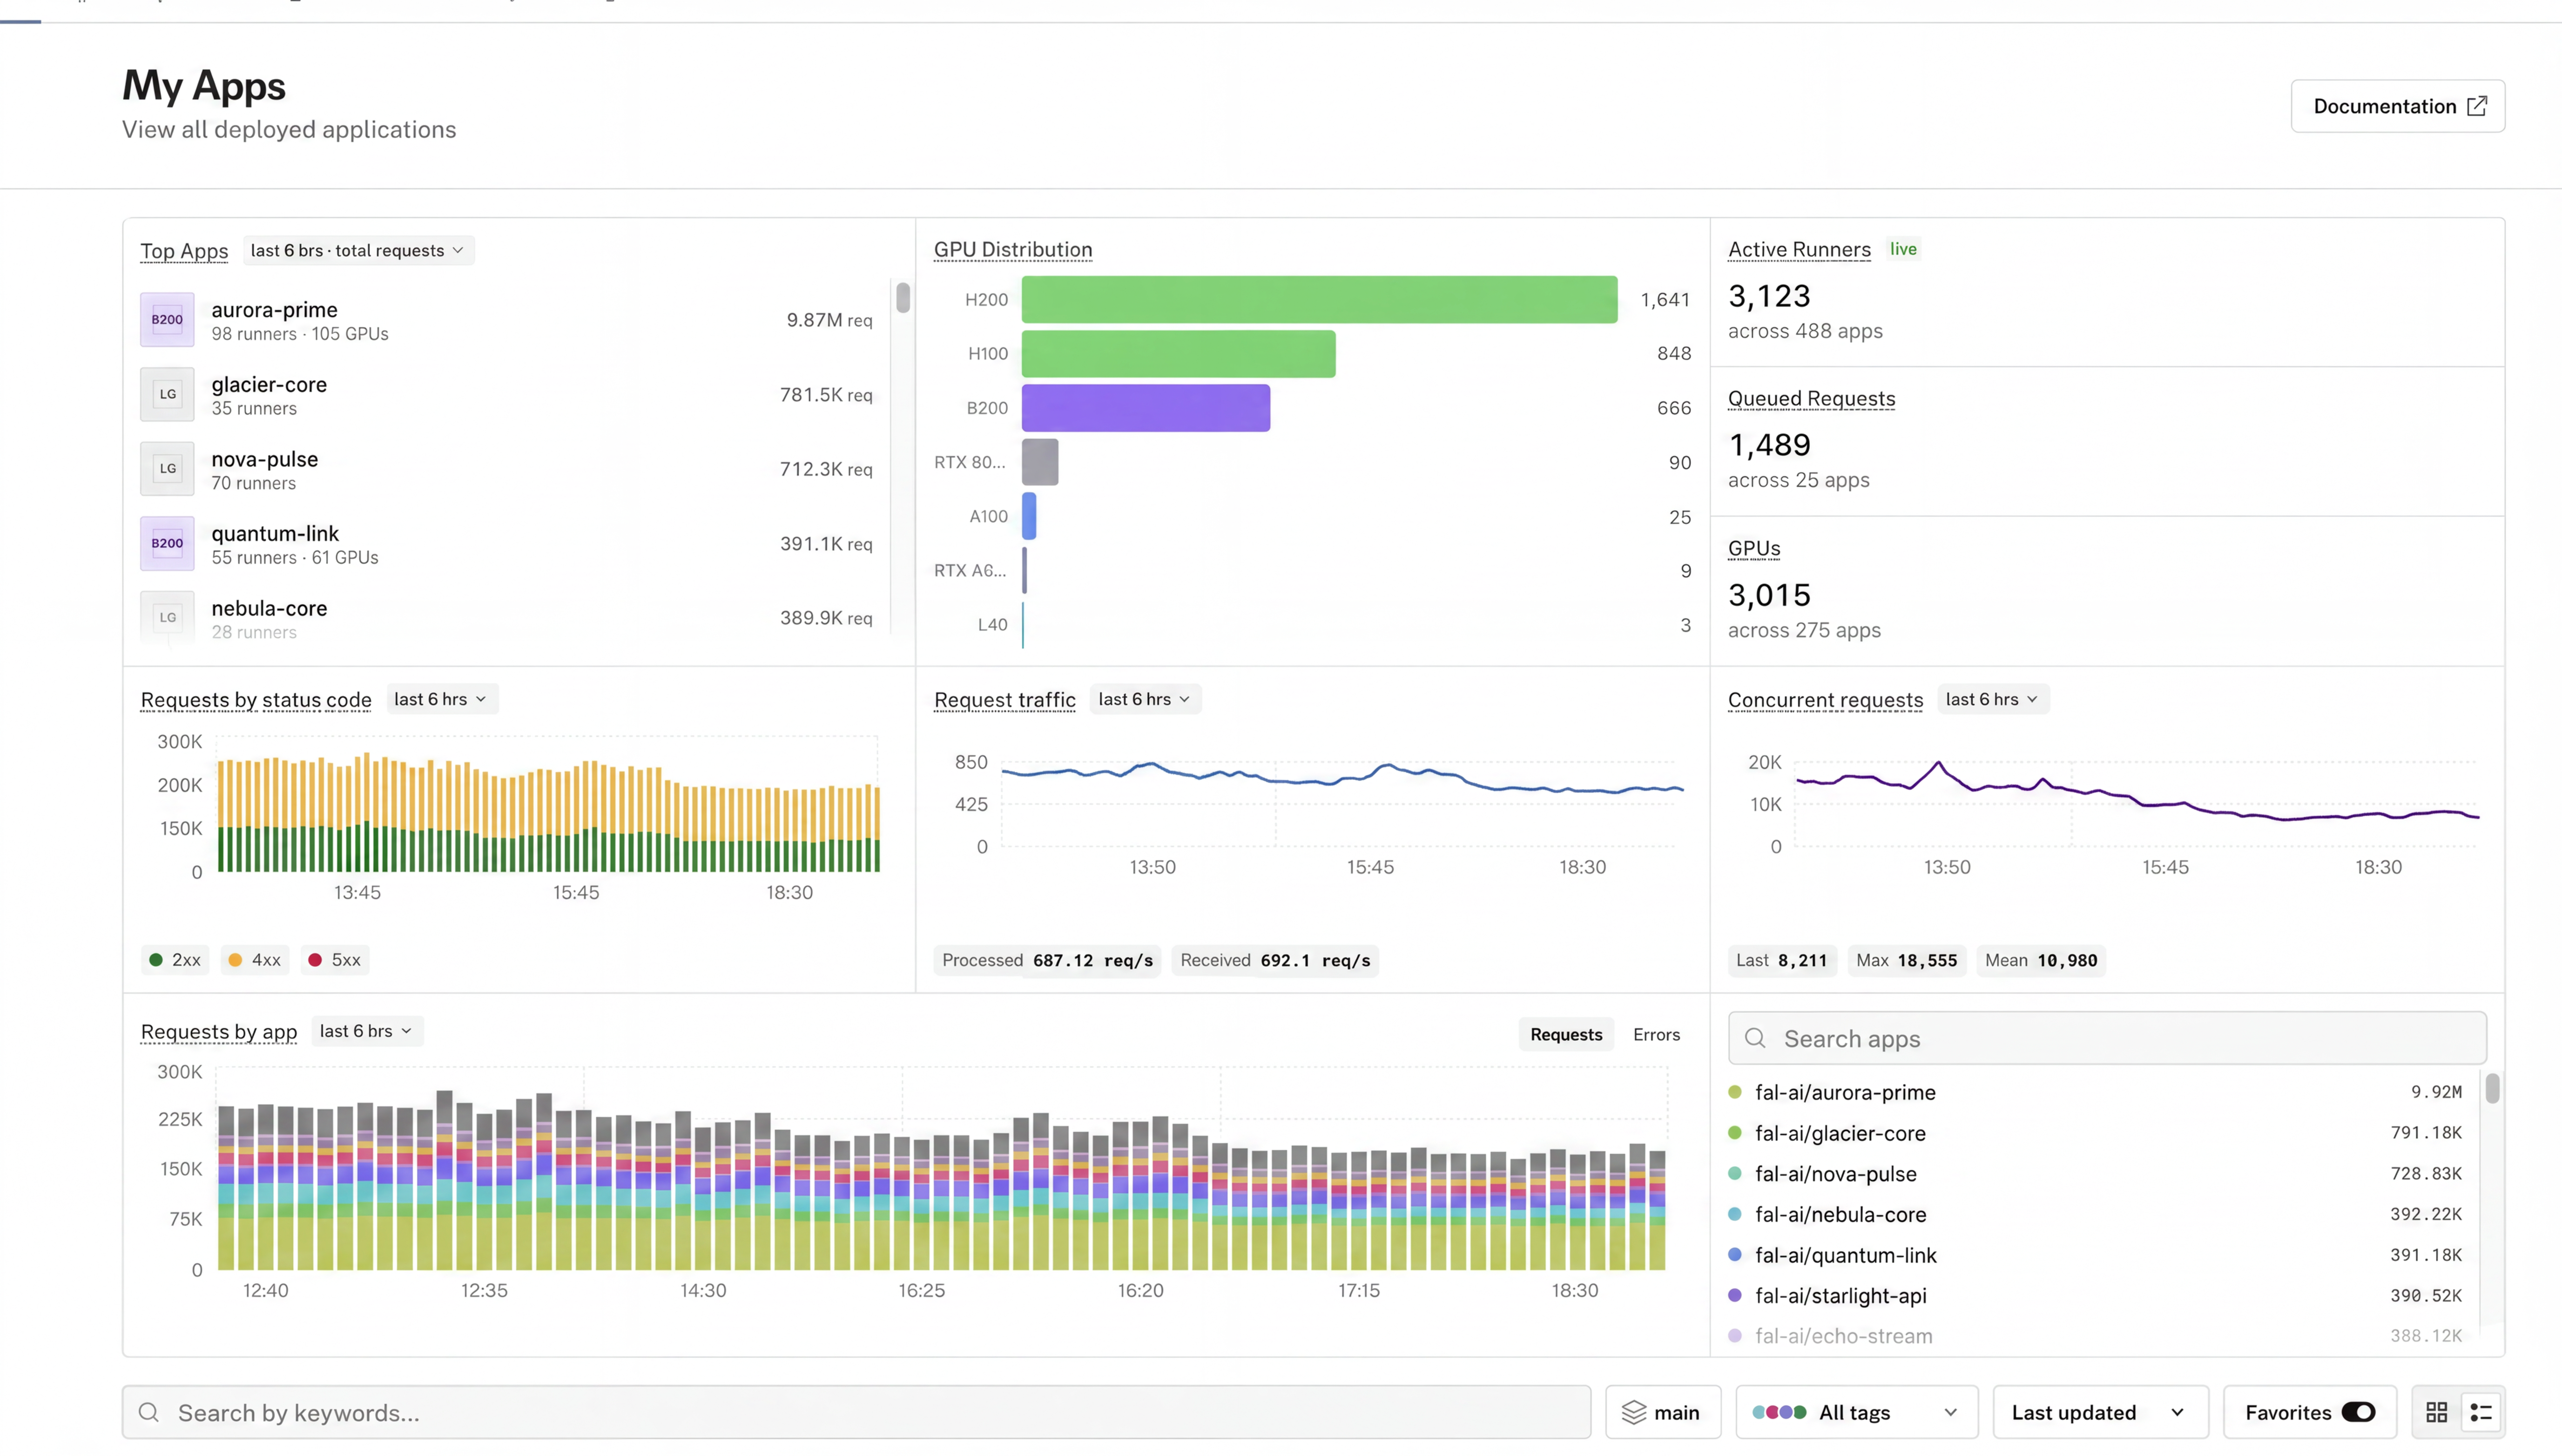
  We introduced new aggregate analytics components on serverless app surfaces to keep health signals consistent between the app listing and each app header.

  * Shared metrics components now power **Runners, Reqs/min, Latency, and Errors** in both app cards and app detail headers
  * Reqs/min, latency, and error trends are shown with directional indicators using recent activity windows, so regressions stand out at a glance
  * App headers now pair those analytics signals with a queue metric, giving a compact operational snapshot before drilling into detailed analytics tabs
</Update>

<Update label="April 28, 2026" tags={["CDN", "Storage"]}>
  ## Legacy CDN Cleanup — June 1st, 2026

  On **June 1st, 2026**, any legacy CDN object not accessed in the past 6 months will be deleted.

  **How to identify legacy objects:** Legacy URLs look like `/files/[animal]/[filename]` (e.g. `/files/otter/AFsfdoliuhhvf.mp4`). Anything served from `/files/b/...` is on our current CDN and is unaffected.

  **If you've accessed it recently, it's already safe:** Any legacy object accessed in the last 6 months has already been automatically migrated to our current CDN — no action needed on your end. The URL is unchanged and the object will be preserved.

  **To keep a legacy object you haven't touched in a while:** Access it once before **June 1st, 2026**. That single access triggers the automatic migration and preserves the object. The URL stays the same.

  **What stays the same:**

  * Legacy URLs continue to work — no code changes needed
  * Anything new you create already uses the modern CDN (`/files/b/...`)
</Update>

<Update label="April 27, 2026" tags={["Serverless", "ComfyUI"]}>
  ## Deploy ComfyUI on fal — Visual Control

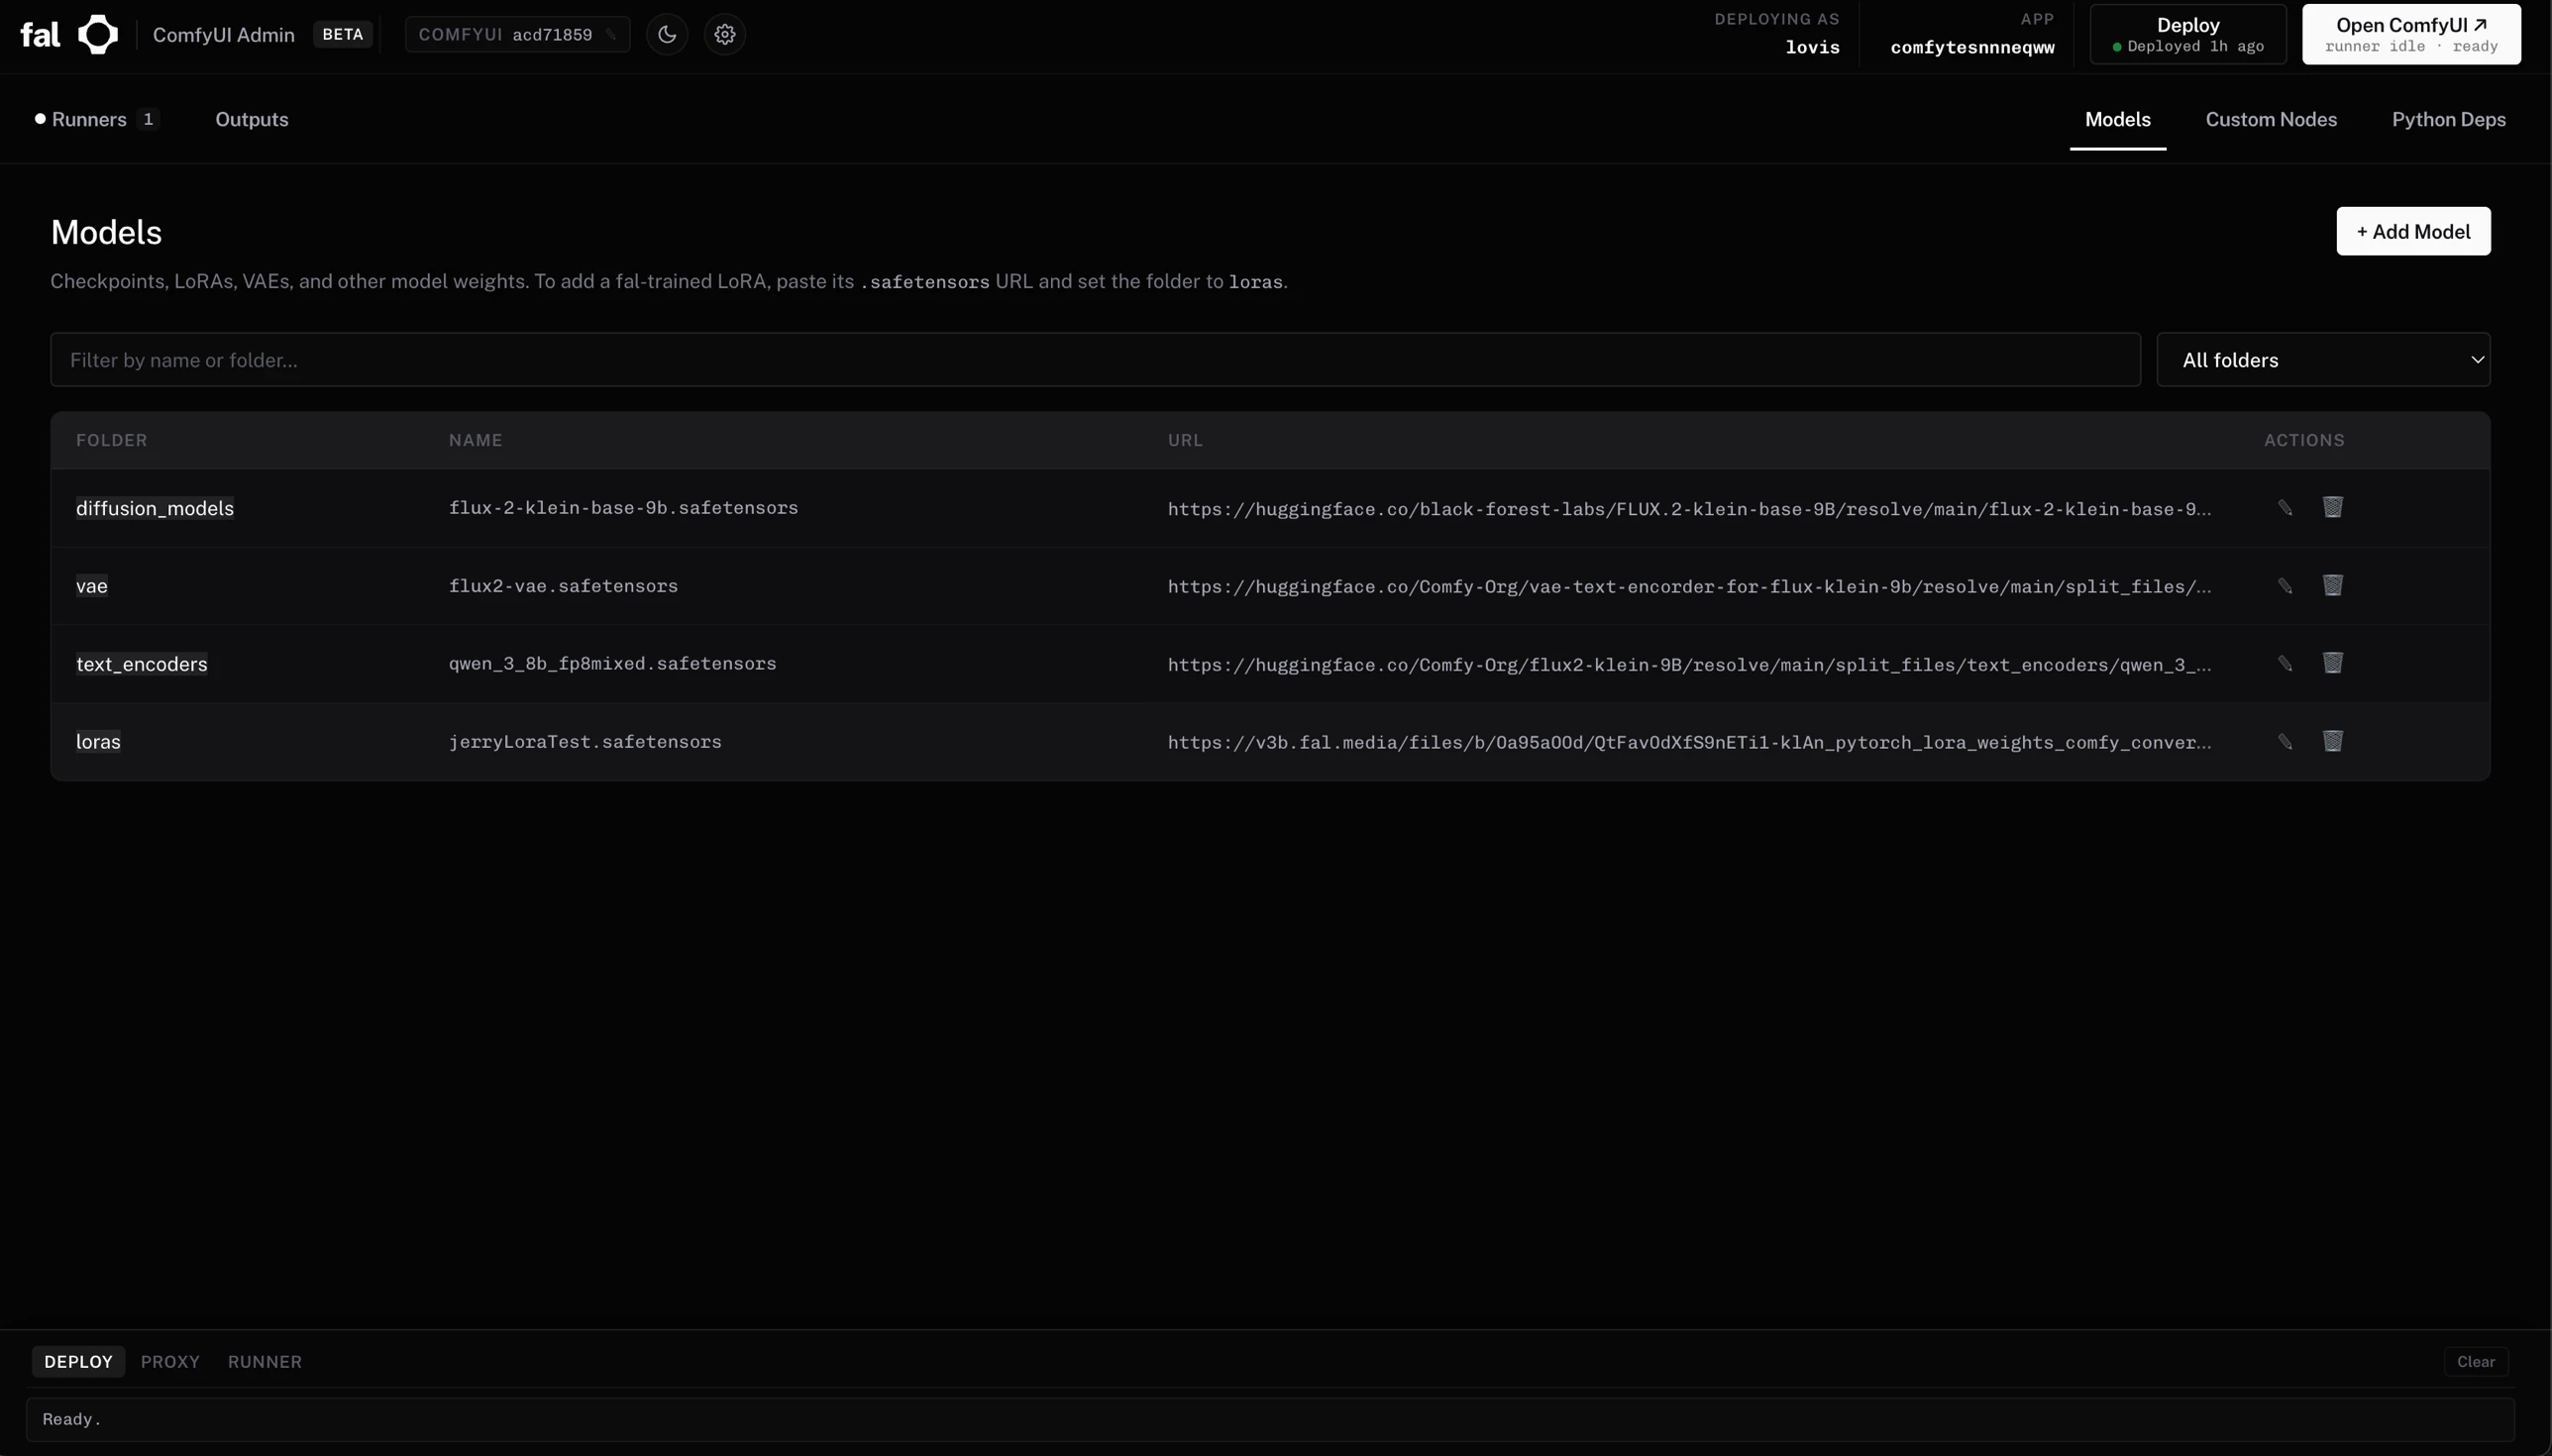
  Run ComfyUI workflows on fal serverless GPUs without writing a single line of code. Two pre-built zip packages, one double-click — your team is generating on H100s in minutes.

  * **User package** — a tiny launcher UI on `localhost:9998`. Paste your fal API key and the endpoint slug your team lead gave you, click **Start**, and the full ComfyUI canvas opens on `localhost:8188` running against the cloud GPU.
  * **Admin package** — a complete management UI on `localhost:9999`. Add models, custom nodes, and Python deps from a table, set HuggingFace / Civitai tokens for gated weights (auto-pushed to fal secrets at deploy), and ship with one click. Live runner observability, an outputs gallery, and an undeploy switch are built in.

  <Frame>
    <img src="https://mintcdn.com/fal-d8505a2e/Un5AMpXNKs4_TsjB/images/changelog/comfyui-visual-admin.png?fit=max&auto=format&n=Un5AMpXNKs4_TsjB&q=85&s=f0f6c87a56d04a741a6a535ea505cc84" alt="Admin web UI showing the Models tab — folders, filenames, download URLs in a table" className="w-full rounded-lg" width="2576" height="1470" data-path="images/changelog/comfyui-visual-admin.png" />
  </Frame>

  The launcher auto-installs `uv` and Python 3.11 on first run — no Python knowledge required from end users. Works on macOS and Windows.

  [Read the guide →](/examples/image-generation/run-comfyui-visual)
</Update>

<Update label="April 23, 2026" tags={["Dashboard", "Serverless"]}>
  ## Runner Termination Reason

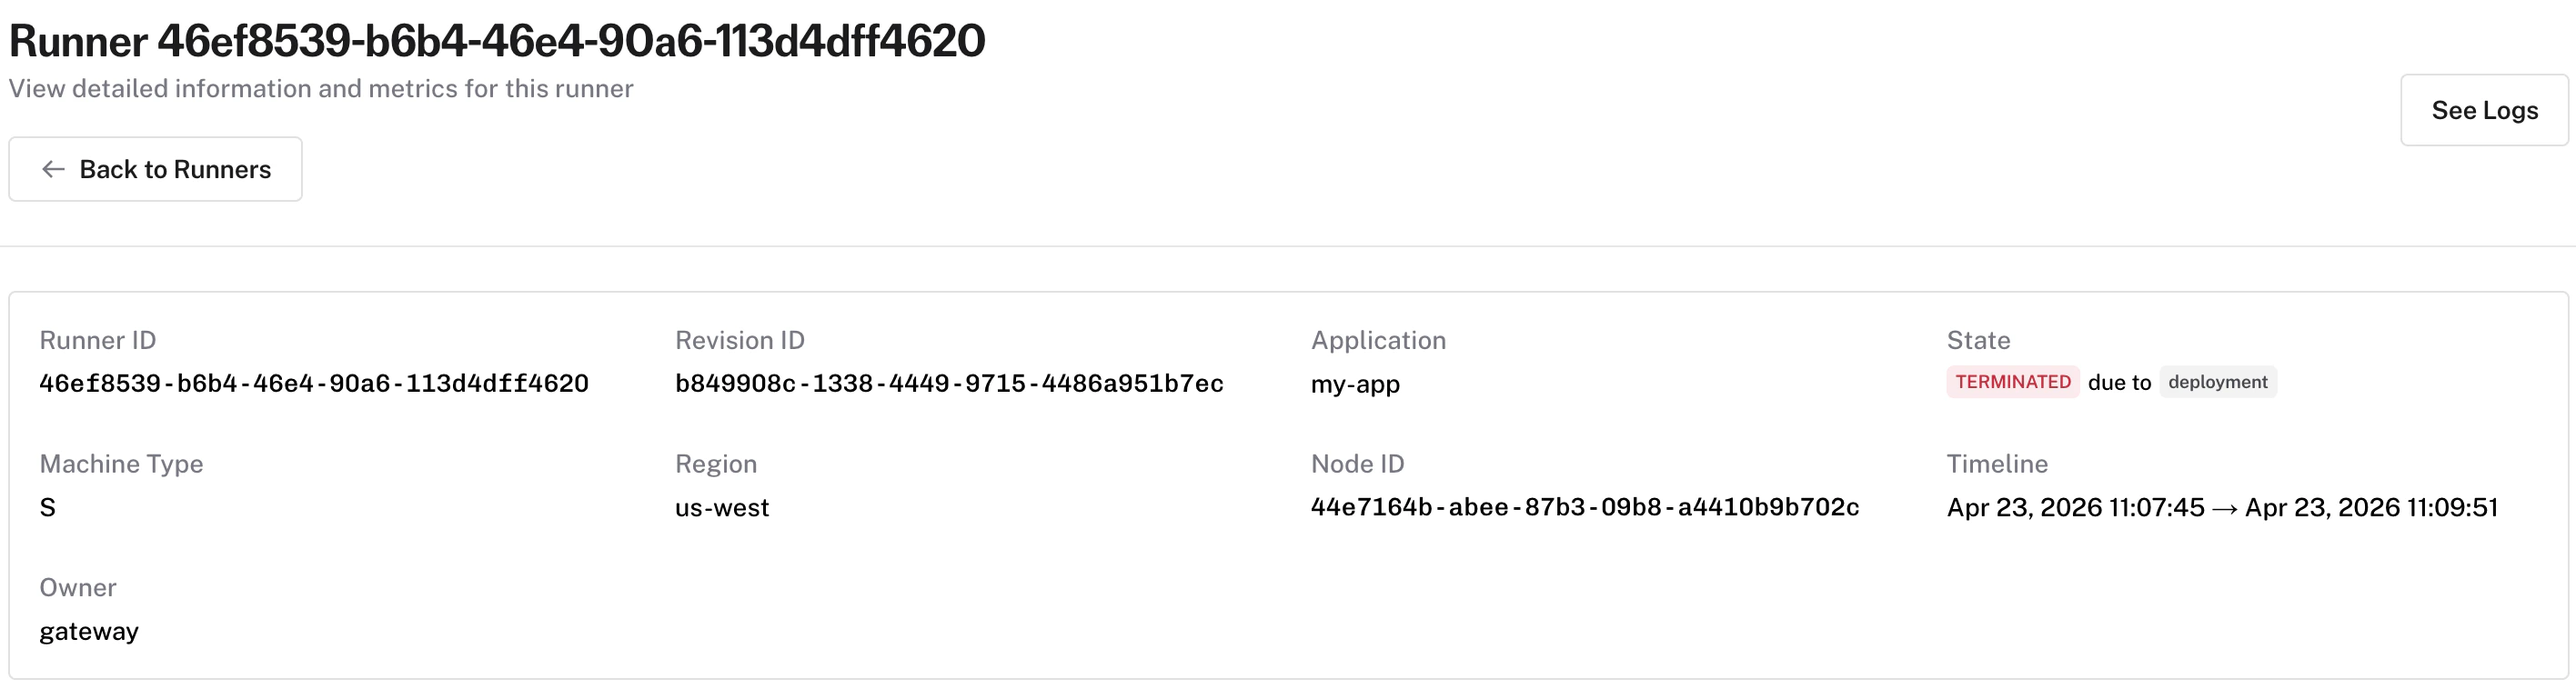
  Diagnose why a runner was terminated directly from the dashboard. The reason now appears across every runner surface.

  * **Runner detail page** — termination reason is shown inline next to the state.

  <Frame>
    <img src="https://mintcdn.com/fal-d8505a2e/GdCSIoK3y-dVum8C/images/changelog/runner-terminate-reason-detail.png?fit=max&auto=format&n=GdCSIoK3y-dVum8C&q=85&s=b855acfc34426bf63bdcc0877d1a2bb1" alt="Runner detail page state section showing termination reason badge" className="w-full rounded-lg" width="2832" height="758" data-path="images/changelog/runner-terminate-reason-detail.png" />
  </Frame>

  * **Runner list** — surfaces the same reason via a tooltip on the state badge, so you can scan failures without opening each runner

  <Frame>
    <img src="https://mintcdn.com/fal-d8505a2e/GdCSIoK3y-dVum8C/images/changelog/runner-terminate-reason-list.png?fit=max&auto=format&n=GdCSIoK3y-dVum8C&q=85&s=86dcc994543b9f7ad36e7ccd4d9a3d9a" alt="Runner list with termination reason tooltip on the state badge" className="w-full rounded-lg" width="2816" height="320" data-path="images/changelog/runner-terminate-reason-list.png" />
  </Frame>

  * **Runner events timeline** — event rows display the termination reason as a highlighted badge alongside the status text

  <Frame>
    <img src="https://mintcdn.com/fal-d8505a2e/GdCSIoK3y-dVum8C/images/changelog/runner-terminate-reason-events.png?fit=max&auto=format&n=GdCSIoK3y-dVum8C&q=85&s=d27c350bee87a53a7357c64e52a3dcd9" alt="Runner event row showing termination reason as a highlighted badge alongside the status text" className="w-full rounded-lg" width="2830" height="500" data-path="images/changelog/runner-terminate-reason-events.png" />
  </Frame>

  Please note that in some cases the termination reason may be unknown. When that happens, no reason badge or tooltip is shown.
</Update>

<Update label="April 23, 2026" tags={["Workflows", "Product"]}>
  ## fal Workflow

  * Improved the model search experience
  * Improved API documentation
  * Smoother workflow when adding models
  * Node IDs are visible in the UI
  * Nodes can be locked
  * Media-type icons on node handles
  * Performance improvements and bug fixes
</Update>

<Update label="April 14, 2026" tags={["Documentation", "API Reference"]}>
  ## Model API Reference

  We've launched a comprehensive **[Model API Reference](/model-api-reference)** — auto-generated documentation for every top model on fal.ai, covering video generation, image generation, audio, vision, and 3D.

  Each model page includes:

  * **Full input/output schemas** with parameter descriptions, types, and defaults
  * **Quick Start code examples** in Python, JavaScript, and cURL
  * **Real prompt-and-output examples** pulled directly from the fal.ai playground
  * **Rich model descriptions** with feature breakdowns, comparisons, and technical specs
  * **Direct playground links** to try models interactively

  The reference is organized by model family (FLUX, Kling Video, Seedance, Nano Banana, Veo, and more) with a navigation structure that mirrors the endpoint hierarchy. Browse by category or jump straight to any endpoint.

  [Explore the Model API Reference →](/model-api-reference)
</Update>

<Update label="April 10, 2026" tags={["Platform API", "Analytics", "Serverless"]}>
  ## Serverless Analytics API

  * New **[`GET /v1/serverless/analytics`](/platform-apis/v1/serverless/analytics)** endpoint lets serverless app owners query time-bucketed analytics across all inbound traffic to their endpoints
  * Retrieve request counts, success/error rates, and latency percentiles (p50/p75/p90) for any date range and timeframe
  * Ideal for exporting analytics to your own tools like BigQuery, Grafana, or Datadog
  * Requires endpoint ownership — only the app owner can access these metrics
  * The existing [`GET /v1/models/analytics`](/platform-apis/v1/models/analytics) continues to show your own request activity as a caller
</Update>

<Update label="April 1, 2026" tags={["Dashboard", "Analytics", "Serverless"]}>
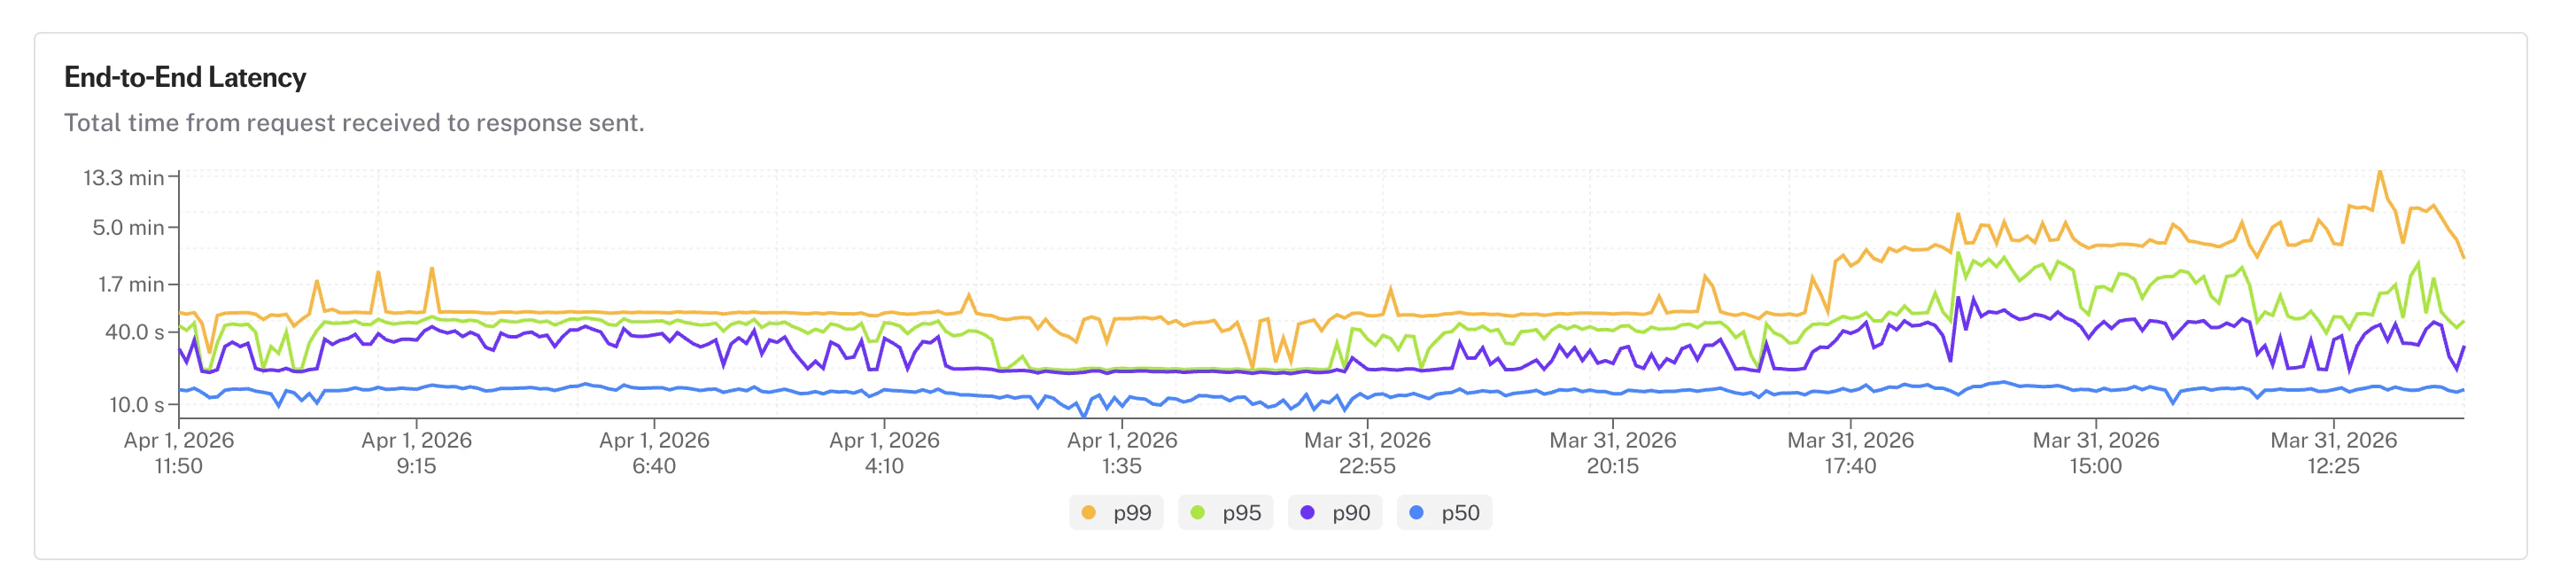
  ## Latency Percentile Chart

  <Frame>
    <img src="https://mintcdn.com/fal-d8505a2e/_K0ozUKUZUyNXY0L/images/changelog/latency-percentile-chart.png?fit=max&auto=format&n=_K0ozUKUZUyNXY0L&q=85&s=b652d30a1d10d515e5c2adada4b7c364" alt="Latency percentile chart showing p50, p90, p95, and p99 over time" className="w-full rounded-lg" width="2908" height="660" data-path="images/changelog/latency-percentile-chart.png" />
  </Frame>

  * The [analytics page](/documentation/serverless/observability/app-analytics) now includes a **latency percentile chart** showing p50, p90, p95, and p99 request latency over time
  * Quickly spot latency regressions or tail-latency spikes at a glance
</Update>

<Update label="March 31, 2026" tags={["Dashboard", "Analytics", "Serverless"]}>
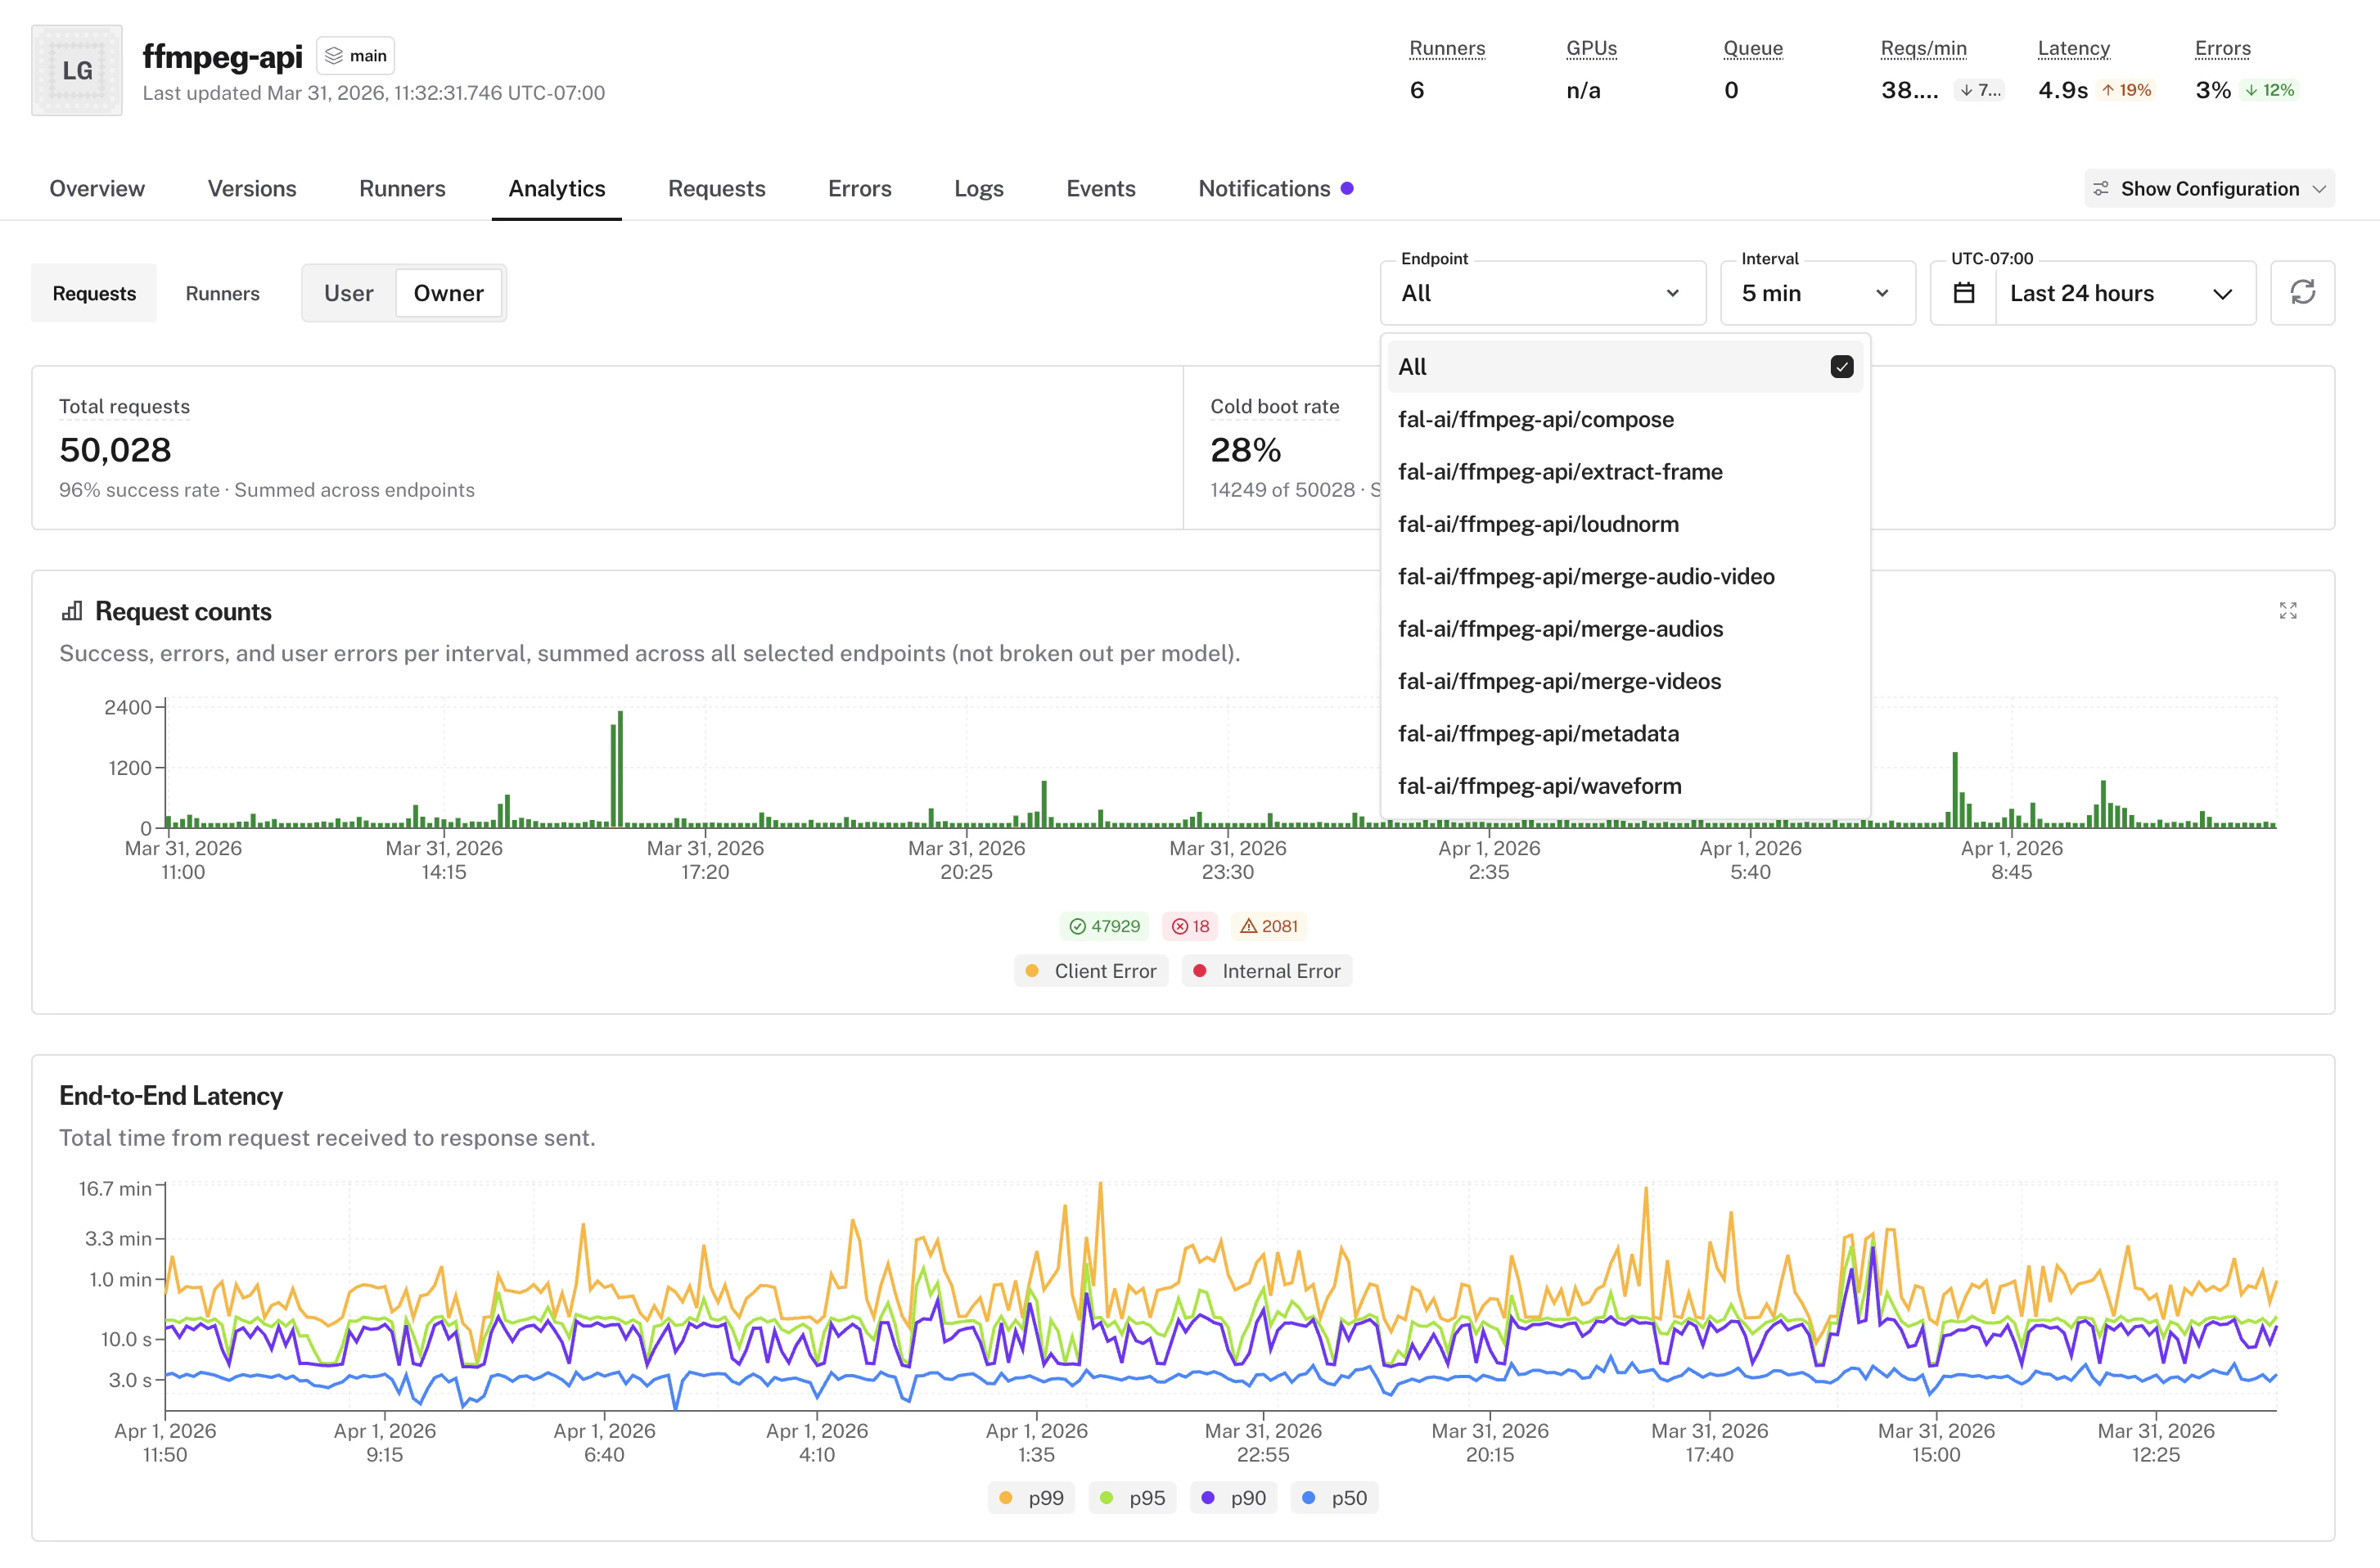
  ## Multi-Endpoint Aggregation in Analytics

  <Frame>
    <img src="https://mintcdn.com/fal-d8505a2e/_K0ozUKUZUyNXY0L/images/changelog/multi-endpoint-aggregation.png?fit=max&auto=format&n=_K0ozUKUZUyNXY0L&q=85&s=612727e3c34f436fb147b05517d4bdd4" alt="Analytics endpoint selector with All option for aggregated metrics" className="w-full rounded-lg" width="2908" height="1916" data-path="images/changelog/multi-endpoint-aggregation.png" />
  </Frame>

  * Select **"All" endpoints** in [App Analytics](/documentation/serverless/observability/app-analytics) to see metrics aggregated across every endpoint at once
  * Aggregation works across request counts, error rates, percentile charts, and gateway stats, so you can get a full picture of your app's performance without switching between endpoints

</Update>

<Update label="March 31, 2026" tags={["Dashboard", "Serverless"]}>
  ## GPU and Runner Metrics on Apps Page

  <Frame>
    <img src="https://mintcdn.com/fal-d8505a2e/_K0ozUKUZUyNXY0L/images/changelog/gpu-runner-metrics-apps.png?fit=max&auto=format&n=_K0ozUKUZUyNXY0L&q=85&s=4d30827b73e8c4dab8707307896f688d" alt="Apps page with aggregate metrics bar showing runners, queue depth, and GPU distribution" className="w-full rounded-lg" width="2908" height="572" data-path="images/changelog/gpu-runner-metrics-apps.png" />
  </Frame>

  * The [apps page](/documentation/deployment/manage-deployments) now shows an **aggregate metrics bar** with total runners, queue depth, and GPU distribution, giving you a quick overview of your resource usage without clicking into each app
  * **Per-app GPU and queue columns** in both card view and list view make it easy to compare usage across apps at a glance

</Update>

<Update label="March 31, 2026" tags={["Dashboard", "Serverless"]}>
  ## Logs Endpoint Filtering and Source Column

  <Frame>
    <img src="https://mintcdn.com/fal-d8505a2e/_K0ozUKUZUyNXY0L/images/changelog/logs-endpoint-source.png?fit=max&auto=format&n=_K0ozUKUZUyNXY0L&q=85&s=0637fb4efb04c9488924b69b2a91cff1" alt="Logs view with endpoint filter and source column" className="w-full rounded-lg" width="4530" height="572" data-path="images/changelog/logs-endpoint-source.png" />
  </Frame>

  * **Filter [logs](/serverless/development/logging) by endpoint** to focus on a specific route
  * A new **Source column** shows which endpoint or system action produced each log line
</Update>

<Update label="March 30, 2026" tags={["Dashboard", "Serverless"]}>
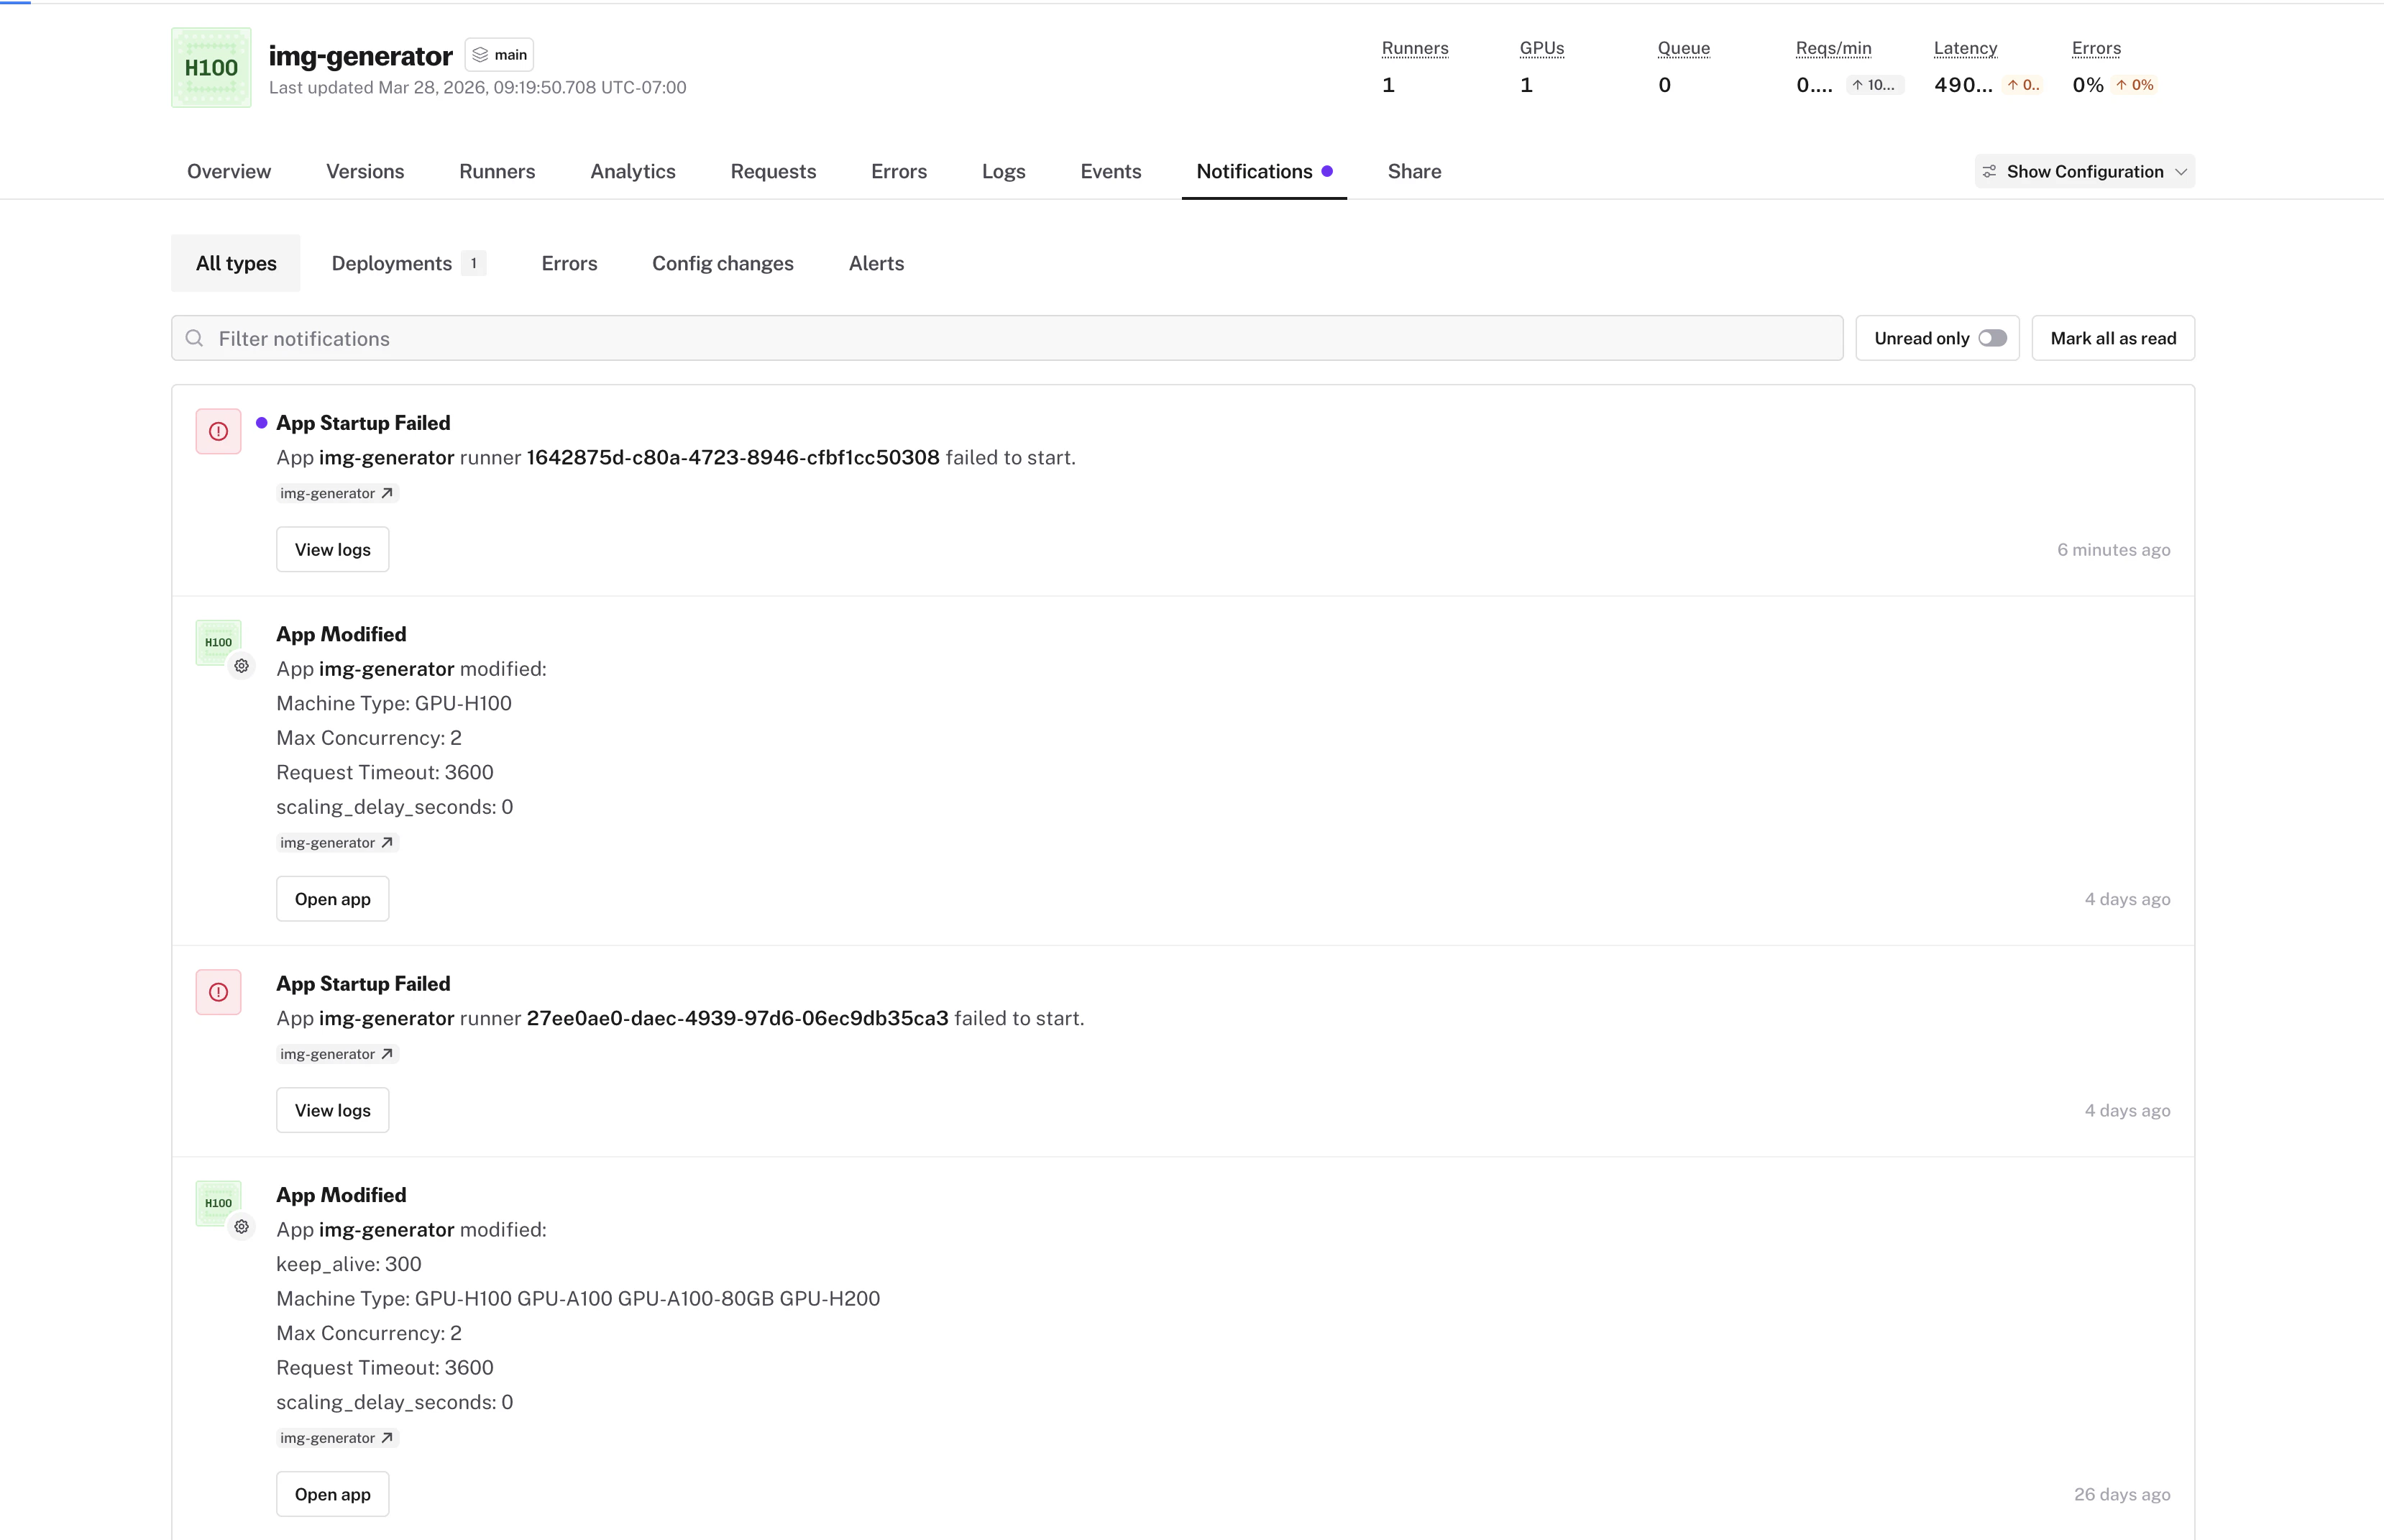
  ## Notifications Overhaul

  <Frame>
    <img src="https://mintcdn.com/fal-d8505a2e/_K0ozUKUZUyNXY0L/images/changelog/notifications-overhaul.png?fit=max&auto=format&n=_K0ozUKUZUyNXY0L&q=85&s=ead345f1f0c40abef26501511f790595" alt="Redesigned notifications dropdown with pagination and mark all read" className="w-full rounded-lg" width="3316" height="2142" data-path="images/changelog/notifications-overhaul.png" />
  </Frame>

  * **Redesigned notification dropdown** so you can stay on top of issues without leaving the page you're on
  * **Category filtering** lets you cut through noise and focus on the notification types that matter to you
  * **Pagination** so you can browse your full notification history without losing your place
  * **Mark all as read** to quickly clear your inbox when you've caught up
  * **OOM alerts** notify you when a runner runs out of memory, so you can resize before it impacts users
  * **Notification badge on app tabs** shows unread counts per app so you know exactly which apps need attention

  See [notification settings](/documentation/serverless/observability/slack-notifications) to configure alerts.
</Update>

<Update label="March 28, 2026" tags={["Dashboard", "Analytics", "Serverless"]}>
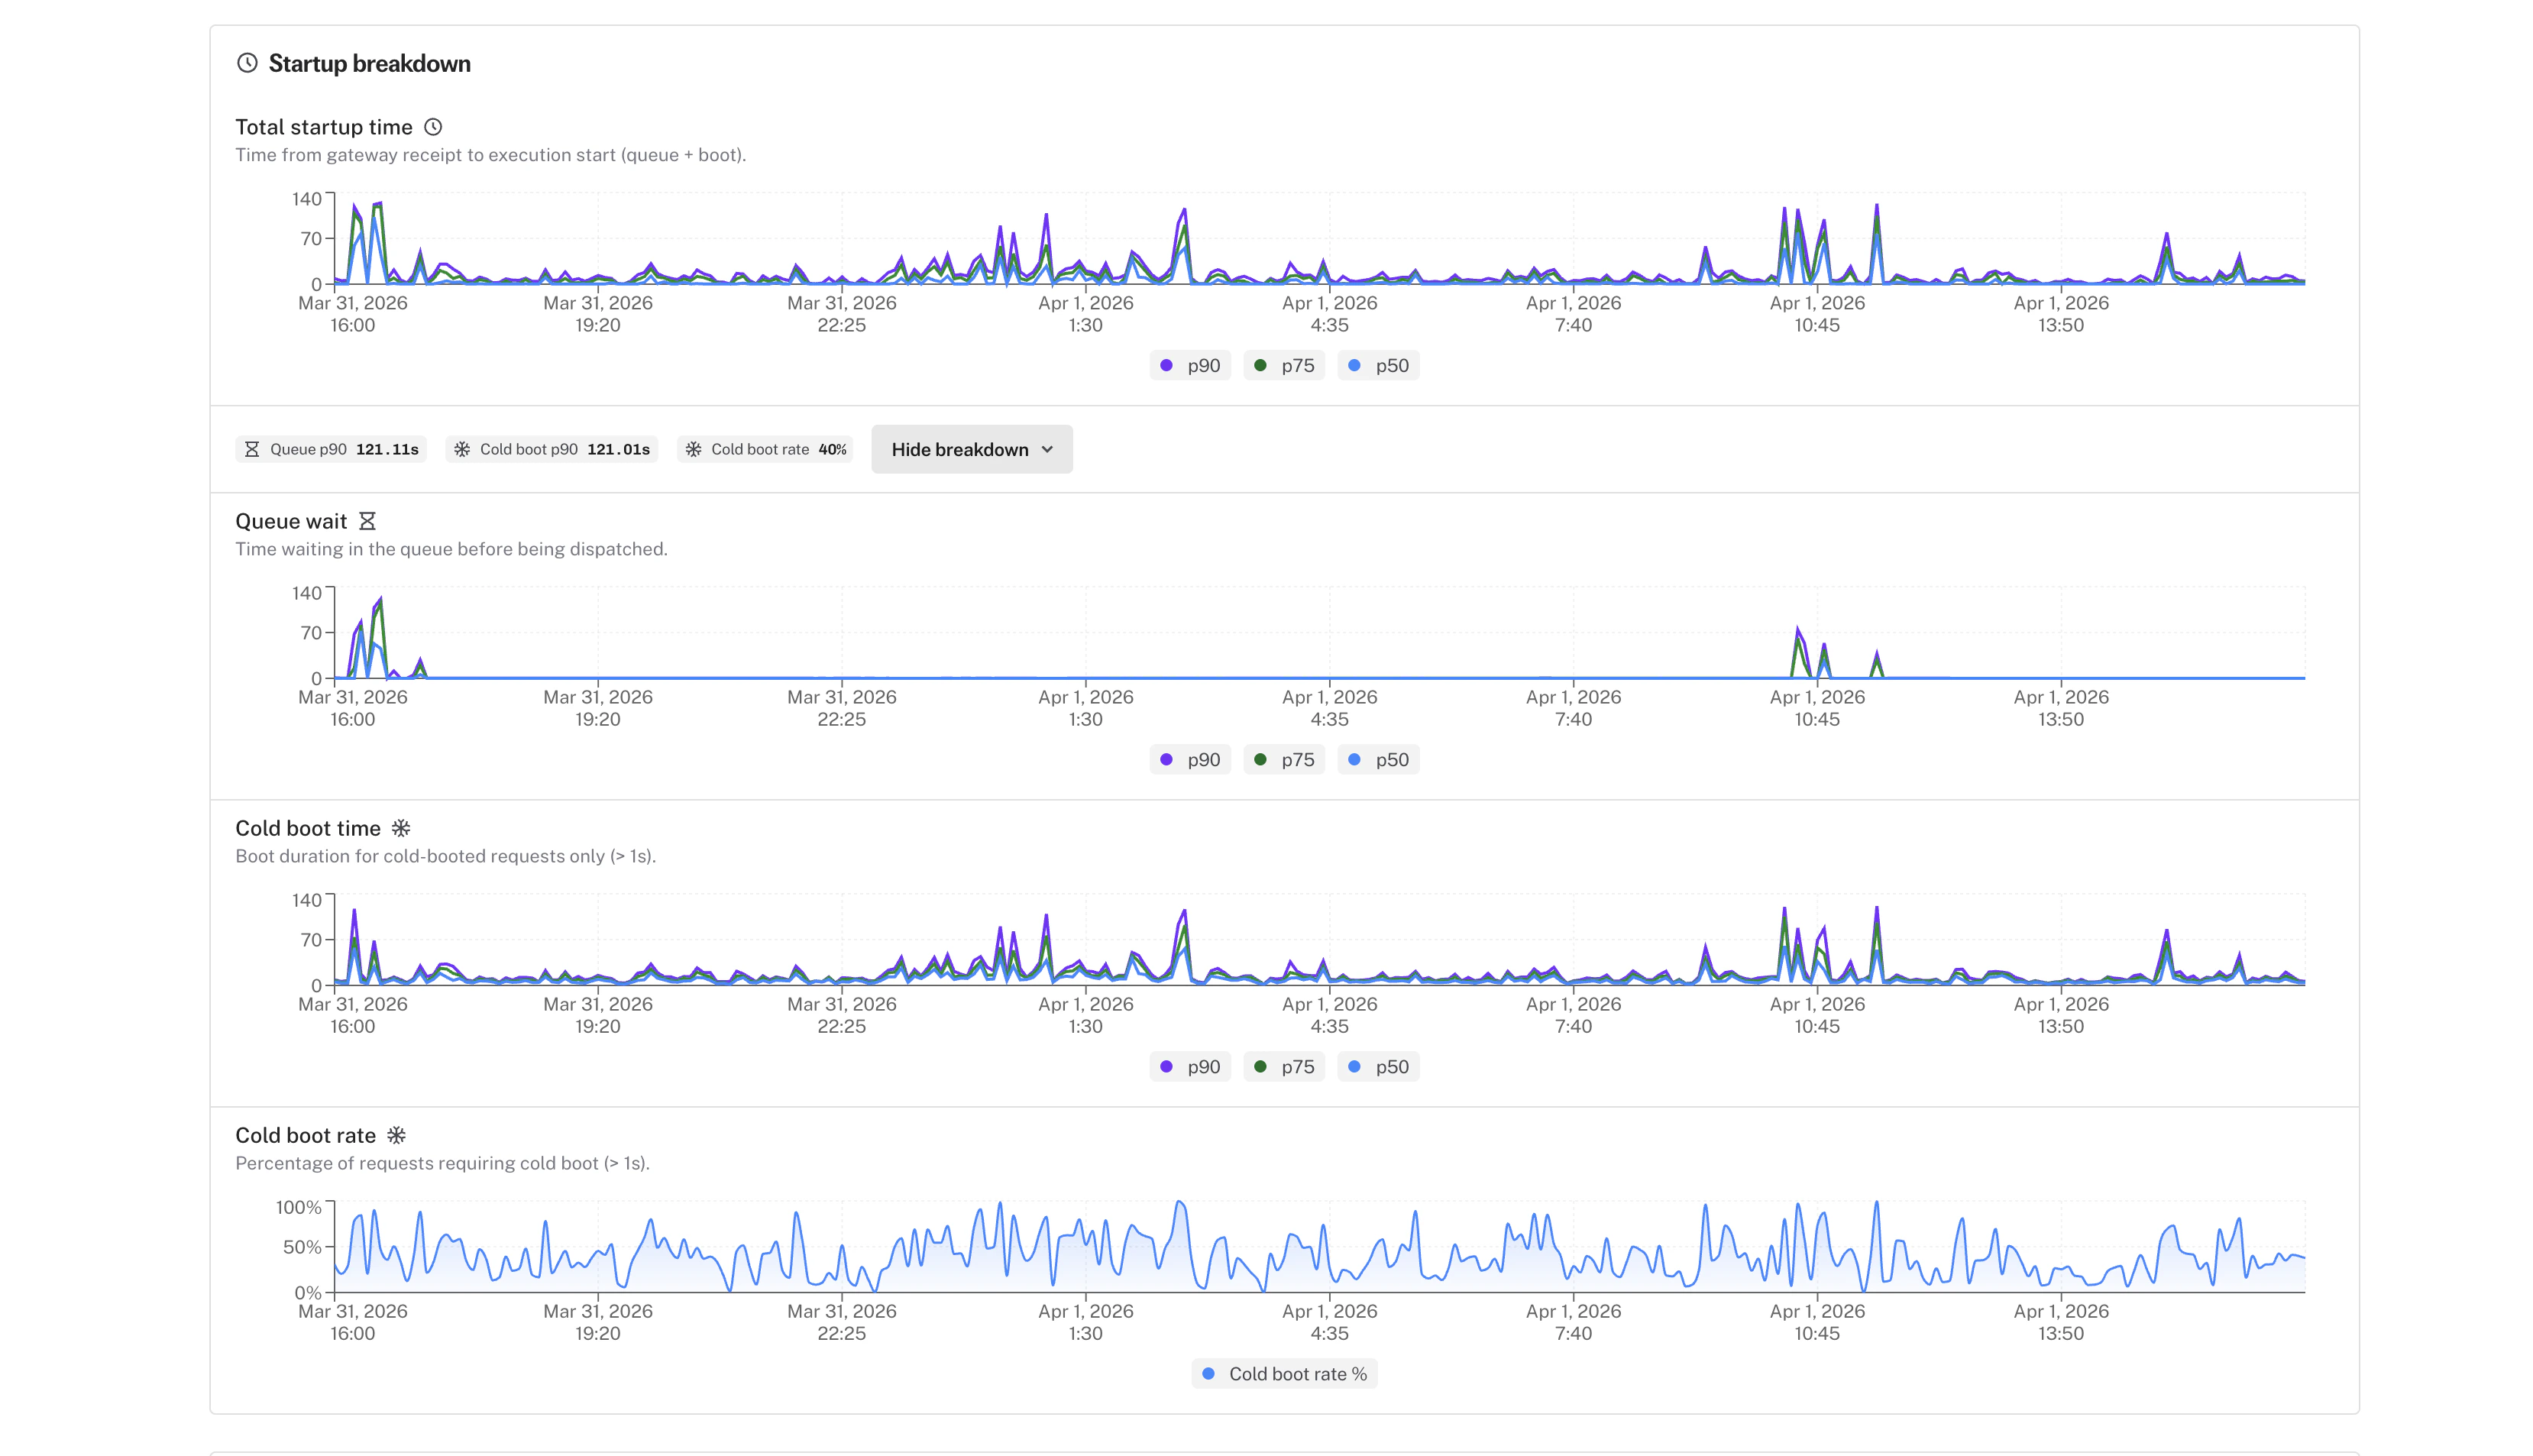
  ## Cold Start and Queue Percentiles

  <Frame>
    <img src="https://mintcdn.com/fal-d8505a2e/_K0ozUKUZUyNXY0L/images/changelog/cold-start-queue-percentiles.png?fit=max&auto=format&n=_K0ozUKUZUyNXY0L&q=85&s=17f96717c19e1fa0ac28027d8a1d49d5" alt="Analytics page showing cold start ratio, cold start percentiles, and queue wait percentiles" className="w-full rounded-lg" width="3316" height="1906" data-path="images/changelog/cold-start-queue-percentiles.png" />
  </Frame>

  * **Cold start ratio** shows what percentage of requests hit a cold start, so you can measure the impact of your scaling configuration
  * **Cold start duration percentiles** (p50, p75, p90, p95) help you understand whether cold starts are a minor delay or a real bottleneck for your users
  * **Queue wait percentiles** (p50, p75, p90, p95) reveal how long requests wait before a runner picks them up, helping you decide if you need more concurrency
  * A new **startup breakdown card** shows exactly where startup time goes (image pull, setup, etc.) so you know what to optimize
  * The [analytics](/documentation/serverless/observability/app-analytics) layout has been redesigned with expandable sections so you can focus on the metrics that matter most

</Update>

<Update label="March 28, 2026" tags={["Dashboard", "Analytics", "Serverless"]}>
  ## Request Throughput Charts

  <Frame>
    <img src="https://mintcdn.com/fal-d8505a2e/_K0ozUKUZUyNXY0L/images/changelog/request-throughput-charts.png?fit=max&auto=format&n=_K0ozUKUZUyNXY0L&q=85&s=63a293ed8a4ebec930f7f3a42eff8be3" alt="Charts showing processed requests per second, received requests per second, and concurrent requests" className="w-full rounded-lg" width="3316" height="544" data-path="images/changelog/request-throughput-charts.png" />
  </Frame>

  New charts are available on the [App Analytics](/documentation/serverless/observability/app-analytics) Requests tab:

  * **Processed requests per second** chart shows your inference throughput over time
  * **Received requests per second** chart shows the inbound request rate
  * **Concurrent requests** chart shows how many requests are in-flight simultaneously
</Update>

<Update label="March 28, 2026" tags={["Dashboard"]}>
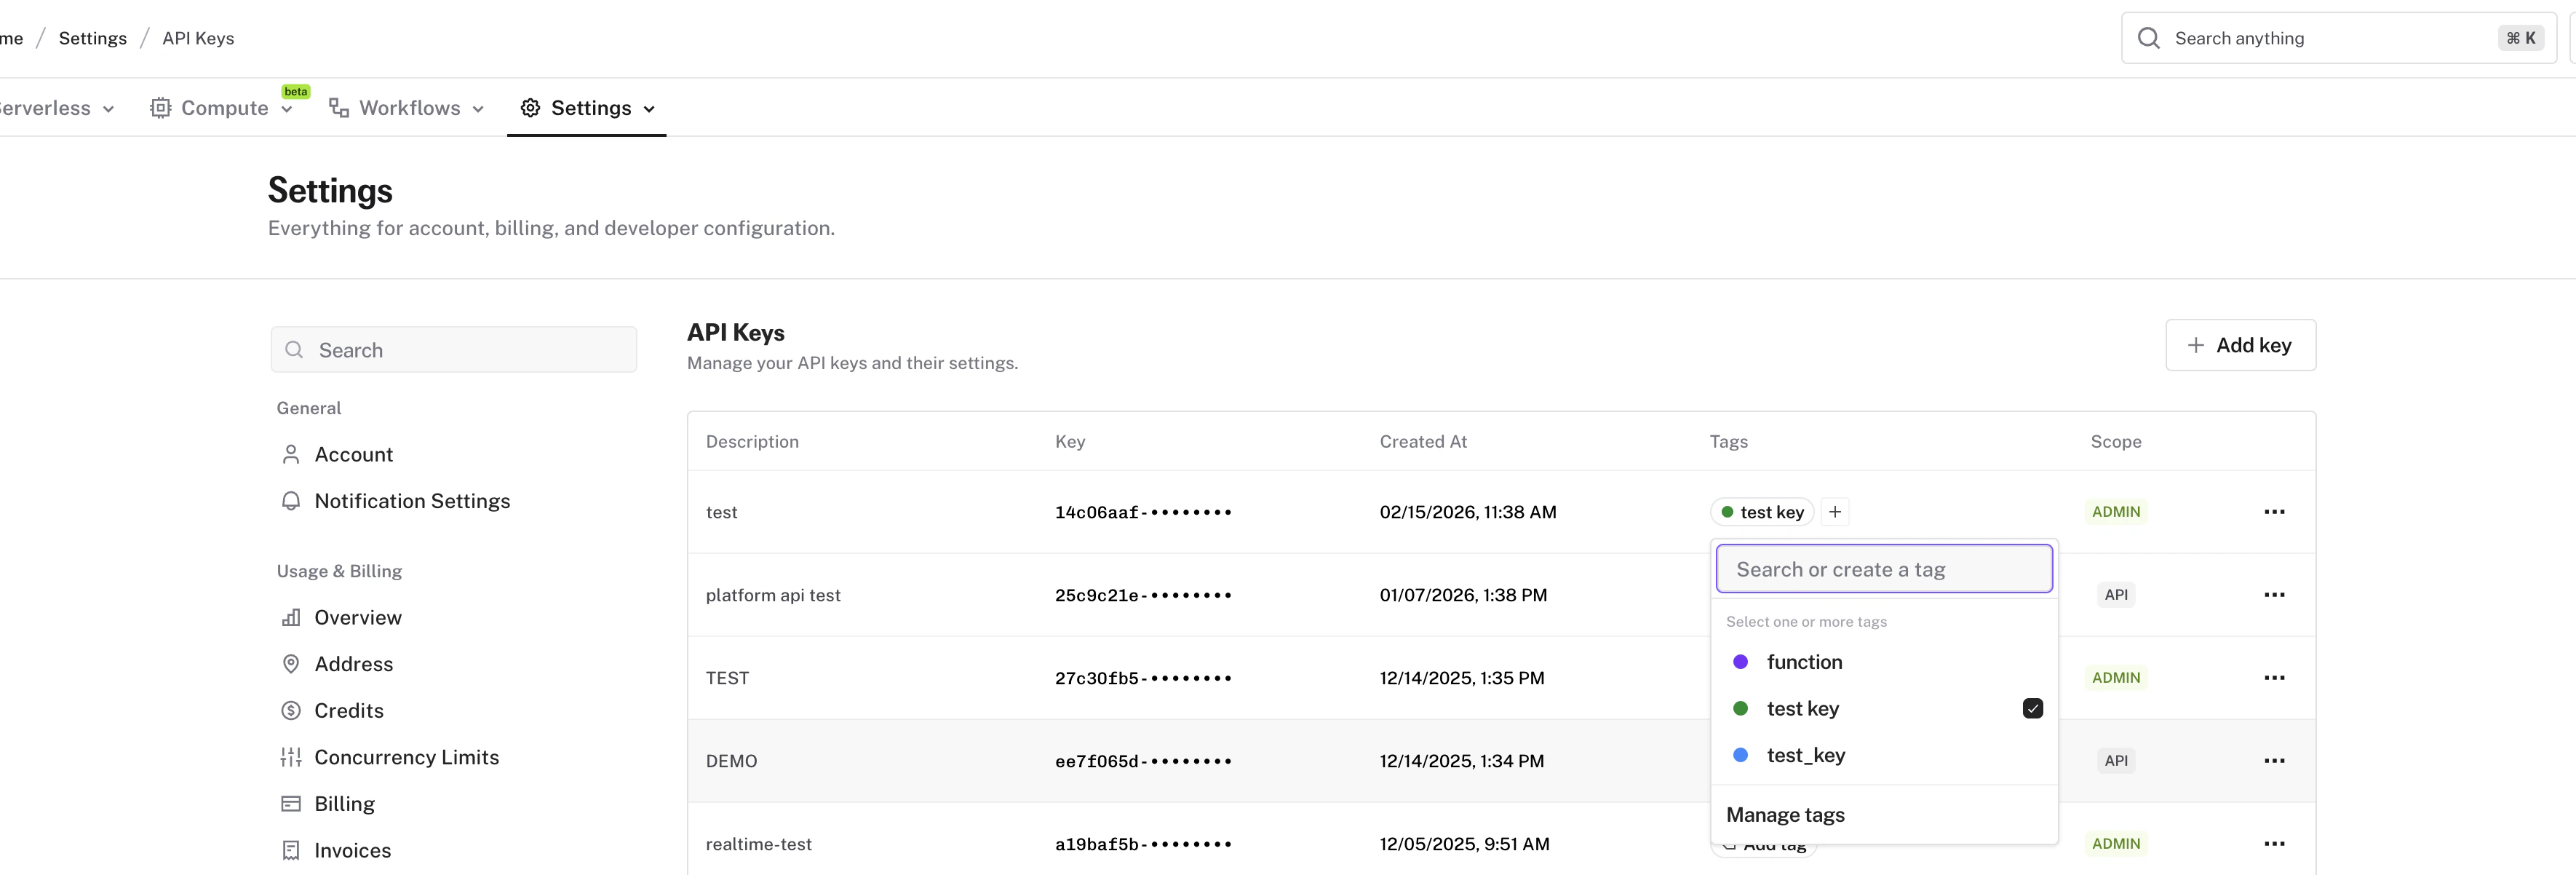
  ## API Key Tags and Editing

  <Frame>
    <img src="https://mintcdn.com/fal-d8505a2e/_K0ozUKUZUyNXY0L/images/changelog/api-key-tags-editing.png?fit=max&auto=format&n=_K0ozUKUZUyNXY0L&q=85&s=433861fbc2313a08b37a7b53c64a55d7" alt="Keys page with tags column and editable key descriptions" className="w-full rounded-lg" width="3540" height="1202" data-path="images/changelog/api-key-tags-editing.png" />
  </Frame>

  * **Tags on [API keys](/documentation/setting-up/authentication/index)** let you organize keys with the same tagging system used for apps
  * **Editable key descriptions** can now be updated directly from the dashboard without recreating the key
</Update>

<Update label="March 27, 2026" tags={["Dashboard", "Serverless"]}>
  ## Request Timing Breakdown

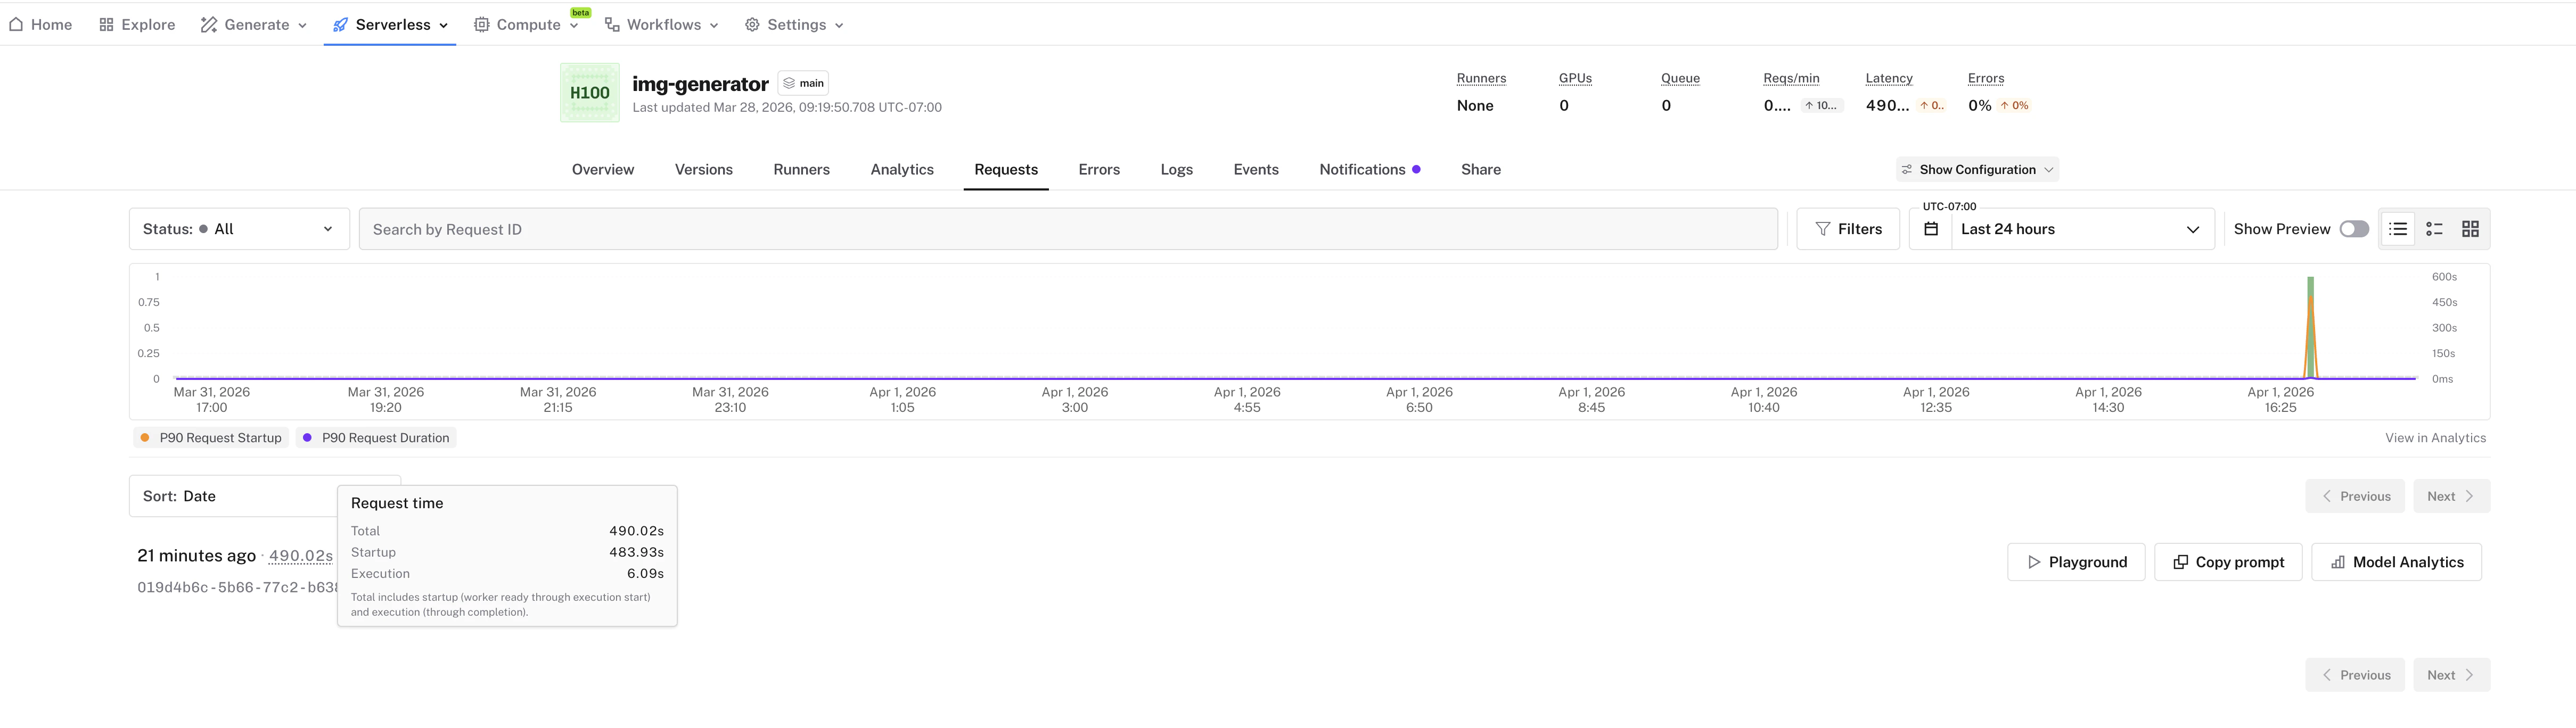
  <Frame>
    <img src="https://mintcdn.com/fal-d8505a2e/_K0ozUKUZUyNXY0L/images/changelog/request-timing-breakdown.png?fit=max&auto=format&n=_K0ozUKUZUyNXY0L&q=85&s=905043093a77cbf45aa840451a649378" alt="Request list showing duration broken into startup time and execution time" className="w-full rounded-lg" width="4838" height="1368" data-path="images/changelog/request-timing-breakdown.png" />
  </Frame>

  * Request duration in the [requests list](/serverless/deployment-operations/monitor-performance) now shows a **breakdown into startup time and execution time**
  * Hover over the duration to see the full timing detail
</Update>

<Update label="March 27, 2026" tags={["Dashboard", "Serverless"]}>
  ## Environment Manager

  <Frame>
    <img src="https://mintcdn.com/fal-d8505a2e/_K0ozUKUZUyNXY0L/images/changelog/environment-manager.png?fit=max&auto=format&n=_K0ozUKUZUyNXY0L&q=85&s=f2ddcafc9f772e06c0aff90ec68643aa" alt="Environment manager dialog for creating and deleting environments" className="w-full rounded-lg" width="2950" height="946" data-path="images/changelog/environment-manager.png" />
  </Frame>

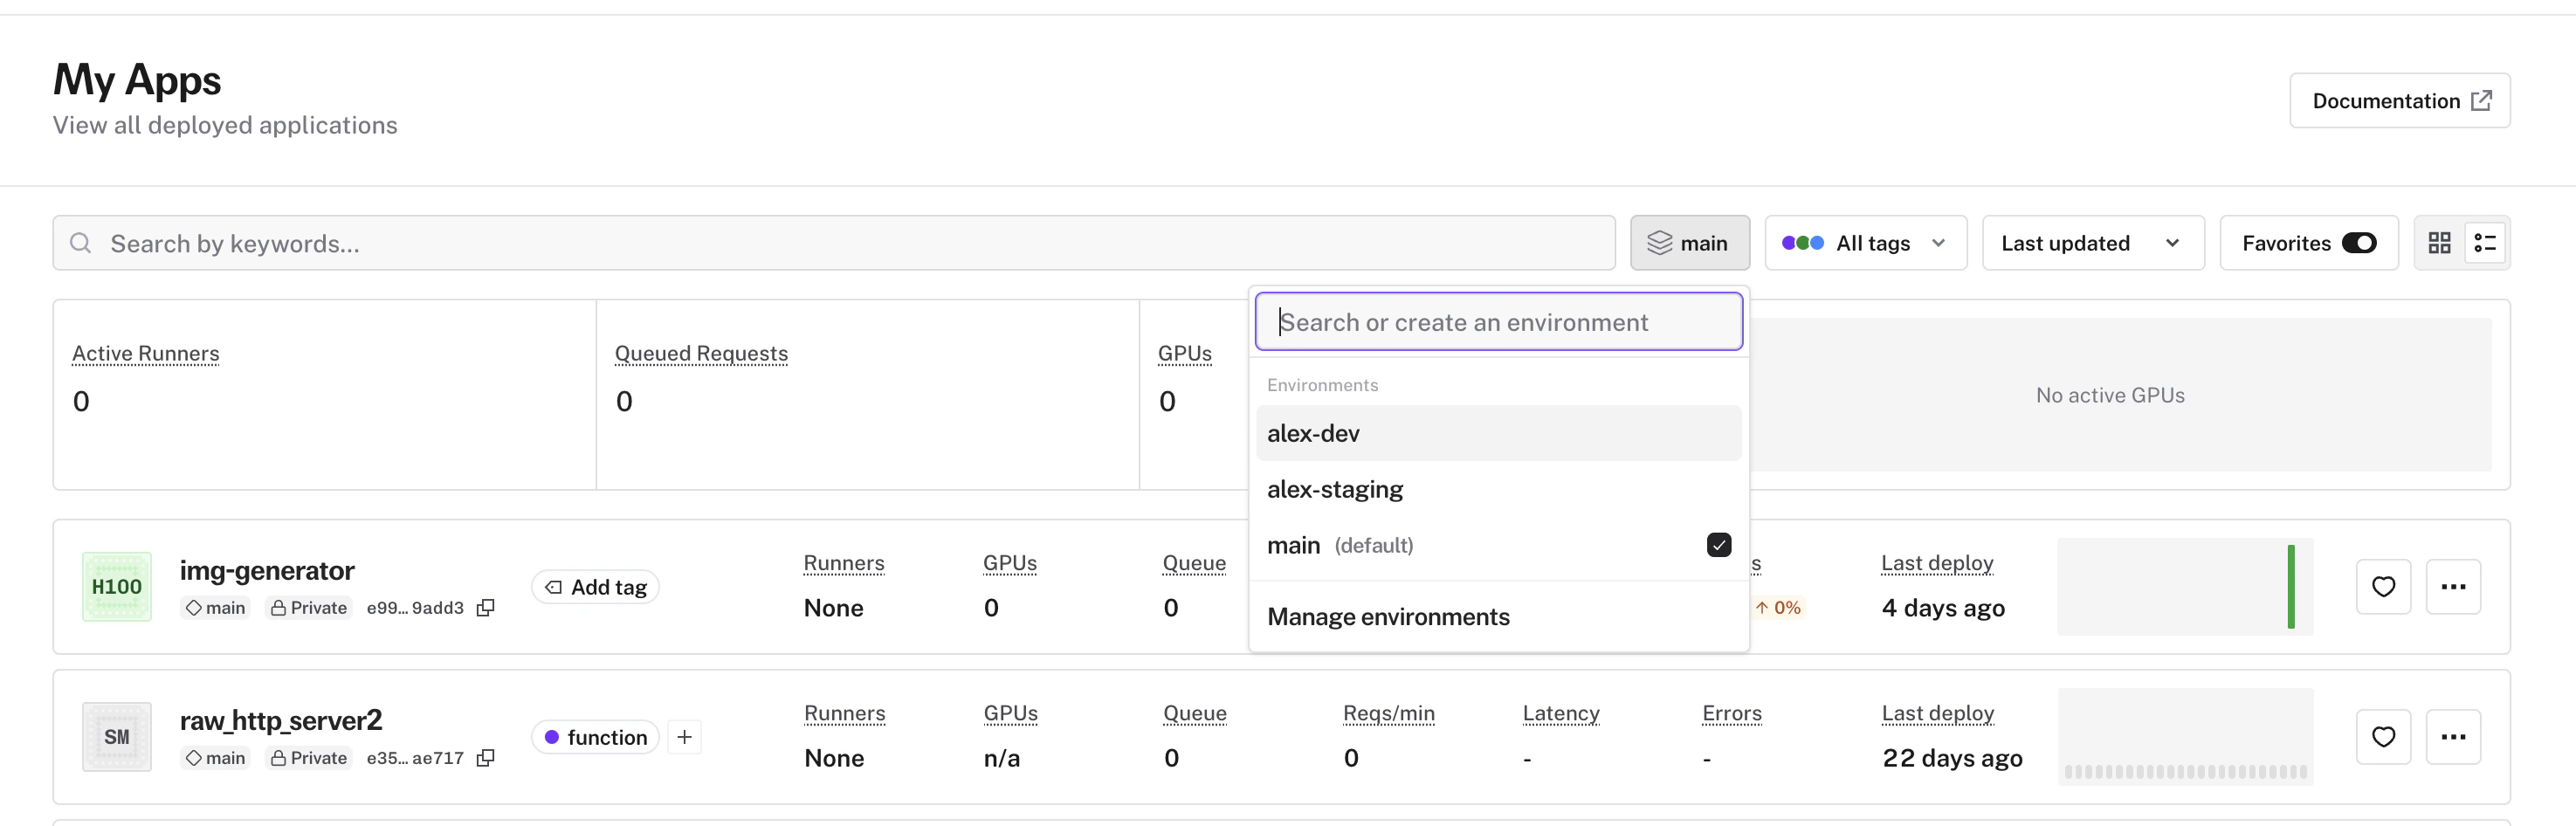
  * A new **[environment manager](/serverless/deployment-operations/manage-environments) dialog** lets you create and delete environments in one place
  * The environment selector is now **searchable**, replacing the old dropdown
</Update>

<Update label="March 25, 2026" tags={["Dashboard", "Serverless"]}>
  ## Requests Page Overhaul

  <Frame>
    <img src="https://mintcdn.com/fal-d8505a2e/o8eW4dsVeOWMw5el/images/changelog/requests-page-overhaul.png?fit=max&auto=format&n=o8eW4dsVeOWMw5el&q=85&s=6f0dec1c687f0a72c19529ae9502d6bc" alt="Requests page with status code charts, p90 latency, and sortable request list" className="w-full rounded-lg" width="5120" height="2510" data-path="images/changelog/requests-page-overhaul.png" />
  </Frame>

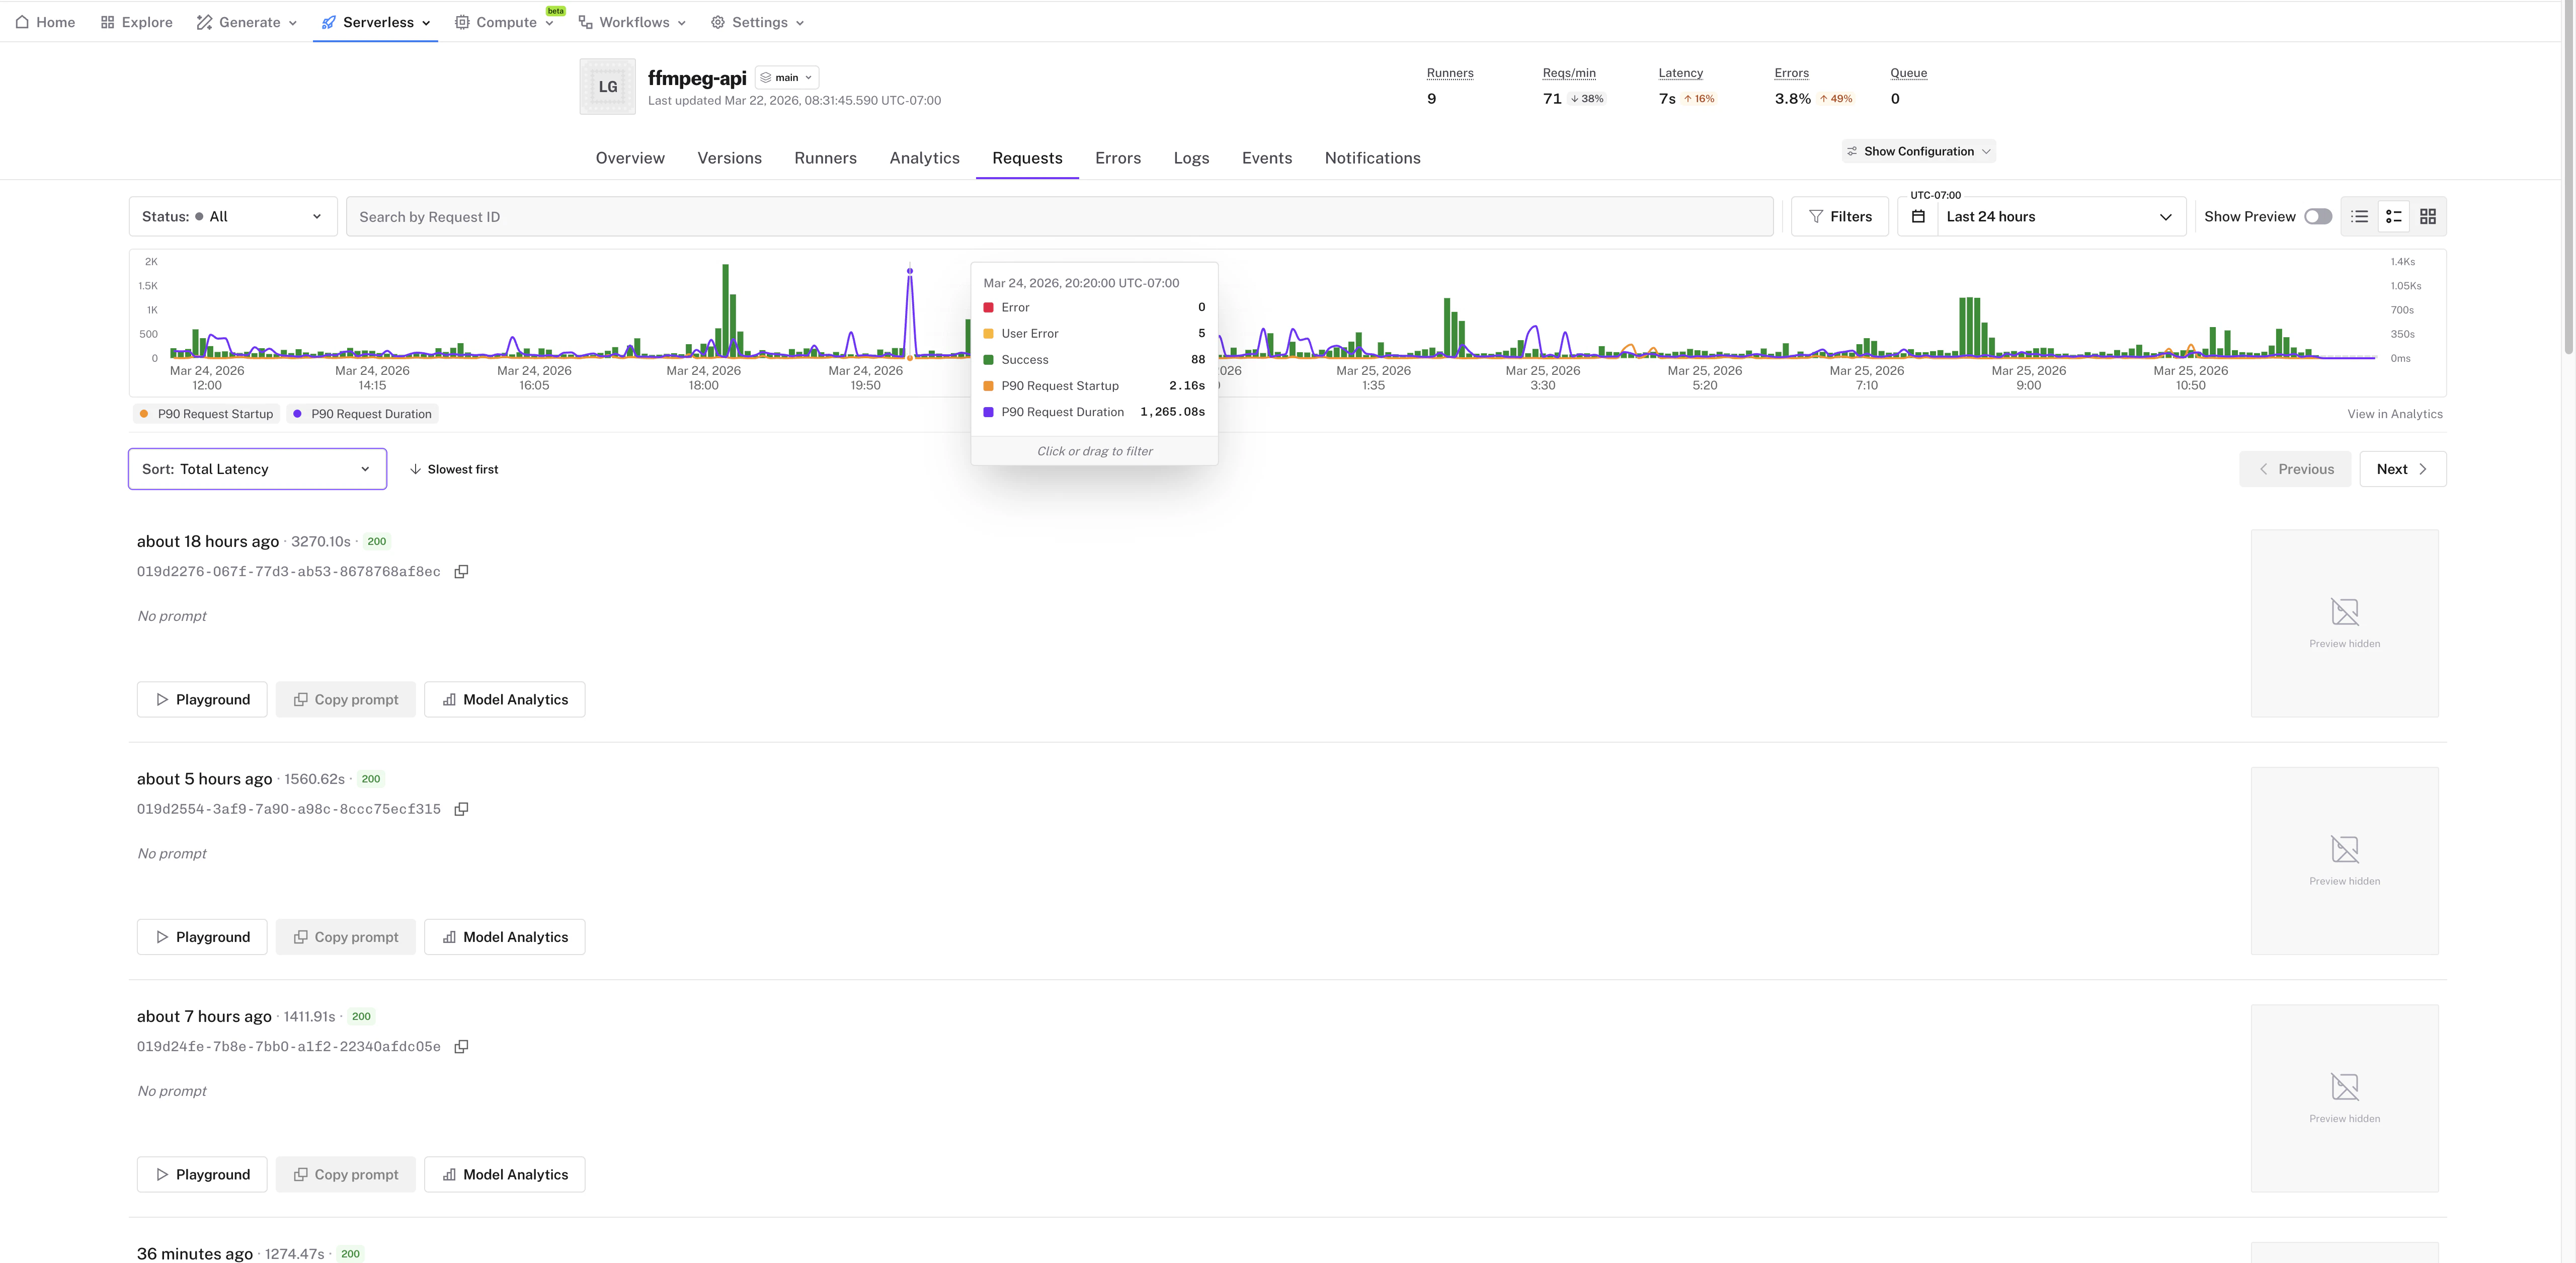
  * **Status code and latency charts** — the requests page now shows interactive charts for request status code distribution and p90 latency over time, giving you an instant picture of your app's health
  * **Click and drag to filter** — select a time range on any chart to filter the request list below to just that window, making it easy to isolate a spike or incident
  * **Sort by cold start, execution time, and latency** — sort the request list by longest cold start duration, execution time, total latency, and more to quickly surface the slowest or most problematic requests
  * **Jump to Analytics** — a direct link takes you from the requests page to App Analytics with your current filters pre-applied
</Update>

<Update label="March 23, 2026" tags={["Dashboard", "Runners", "Serverless"]}>
  ## Runner Summary on App Overview

  <Frame>
    <img src="https://mintcdn.com/fal-d8505a2e/o8eW4dsVeOWMw5el/images/changelog/runner-summary-card.png?fit=max&auto=format&n=o8eW4dsVeOWMw5el&q=85&s=659748d93f5c17e43f616c0c86d99973" alt="Runner summary card showing active runner counts, state breakdowns, and concurrency trend" className="w-full rounded-lg" width="1022" height="920" data-path="images/changelog/runner-summary-card.png" />
  </Frame>

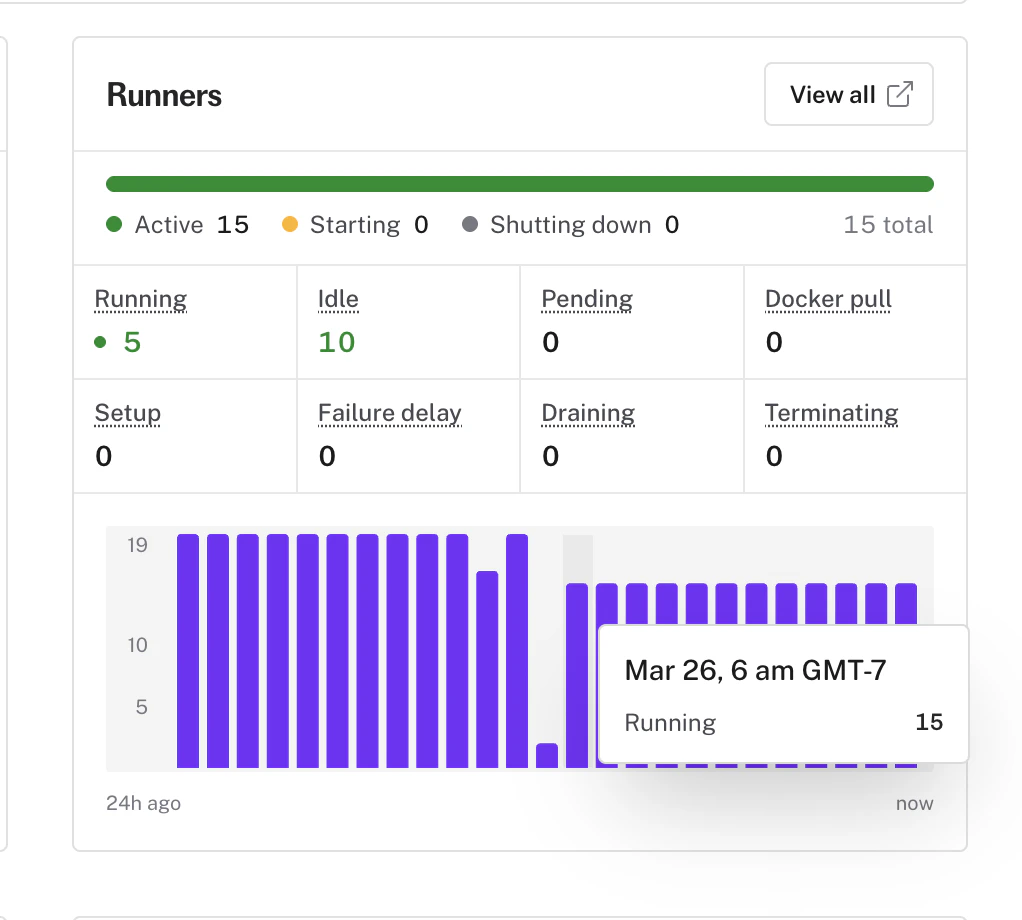
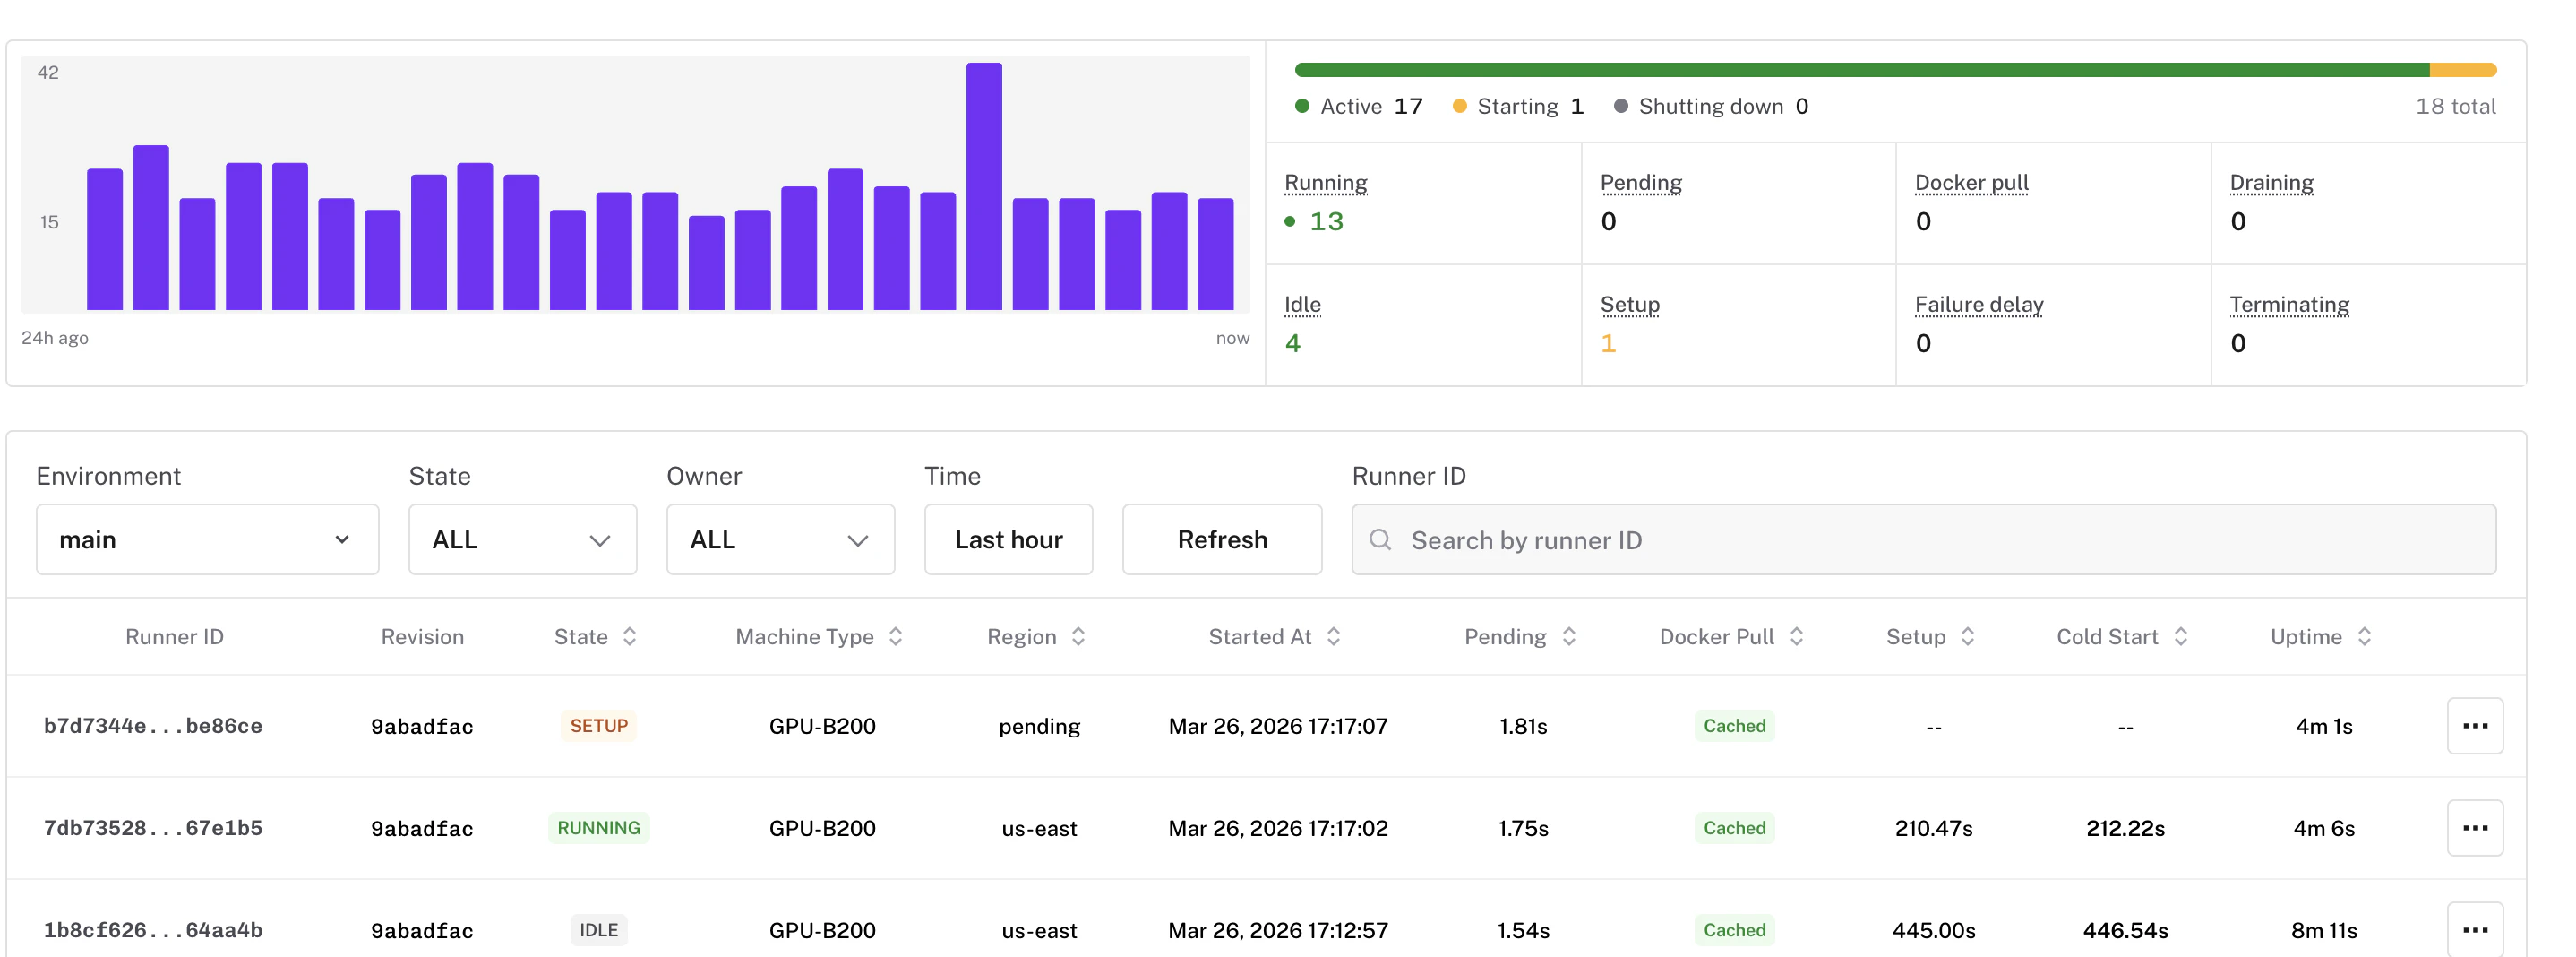
  * The app overview page now includes a **runner summary card** showing active runner counts, state breakdowns, and a concurrency trend chart at a glance
  * Quickly see how many runners are in each state (running, idle, pending, setup) without navigating to the Runners page
</Update>

<Update label="March 20, 2026" tags={["Dashboard", "Runners", "Serverless"]}>
  ## Search Runners by ID

  <Frame>
    <img src="https://mintcdn.com/fal-d8505a2e/o8eW4dsVeOWMw5el/images/changelog/runner-id-search.png?fit=max&auto=format&n=o8eW4dsVeOWMw5el&q=85&s=f1b14ce93d0862ff6364bcd8e5806cb7" alt="Runner ID search on the Runners page" className="w-full rounded-lg" width="2876" height="1068" data-path="images/changelog/runner-id-search.png" />
  </Frame>

  * Search for a specific runner by its ID on the Runners page — useful when you have a runner ID from logs, alerts, or incident reports
  * Results display instantly with full runner details, and the Refresh button re-fetches the searched runner
</Update>

<Update label="March 20, 2026" tags={["Dashboard", "Serverless"]}>
  ## Error Types in App Requests and Errors pages

  <Frame>
    <img src="https://mintcdn.com/fal-d8505a2e/o8eW4dsVeOWMw5el/images/changelog/error-types-ui.png?fit=max&auto=format&n=o8eW4dsVeOWMw5el&q=85&s=28a9aeb6cfea6071d12d5858af5c9ae7" alt="Error type badges on request logs showing specific failure reasons" className="w-full rounded-lg" width="4896" height="1082" data-path="images/changelog/error-types-ui.png" />
  </Frame>

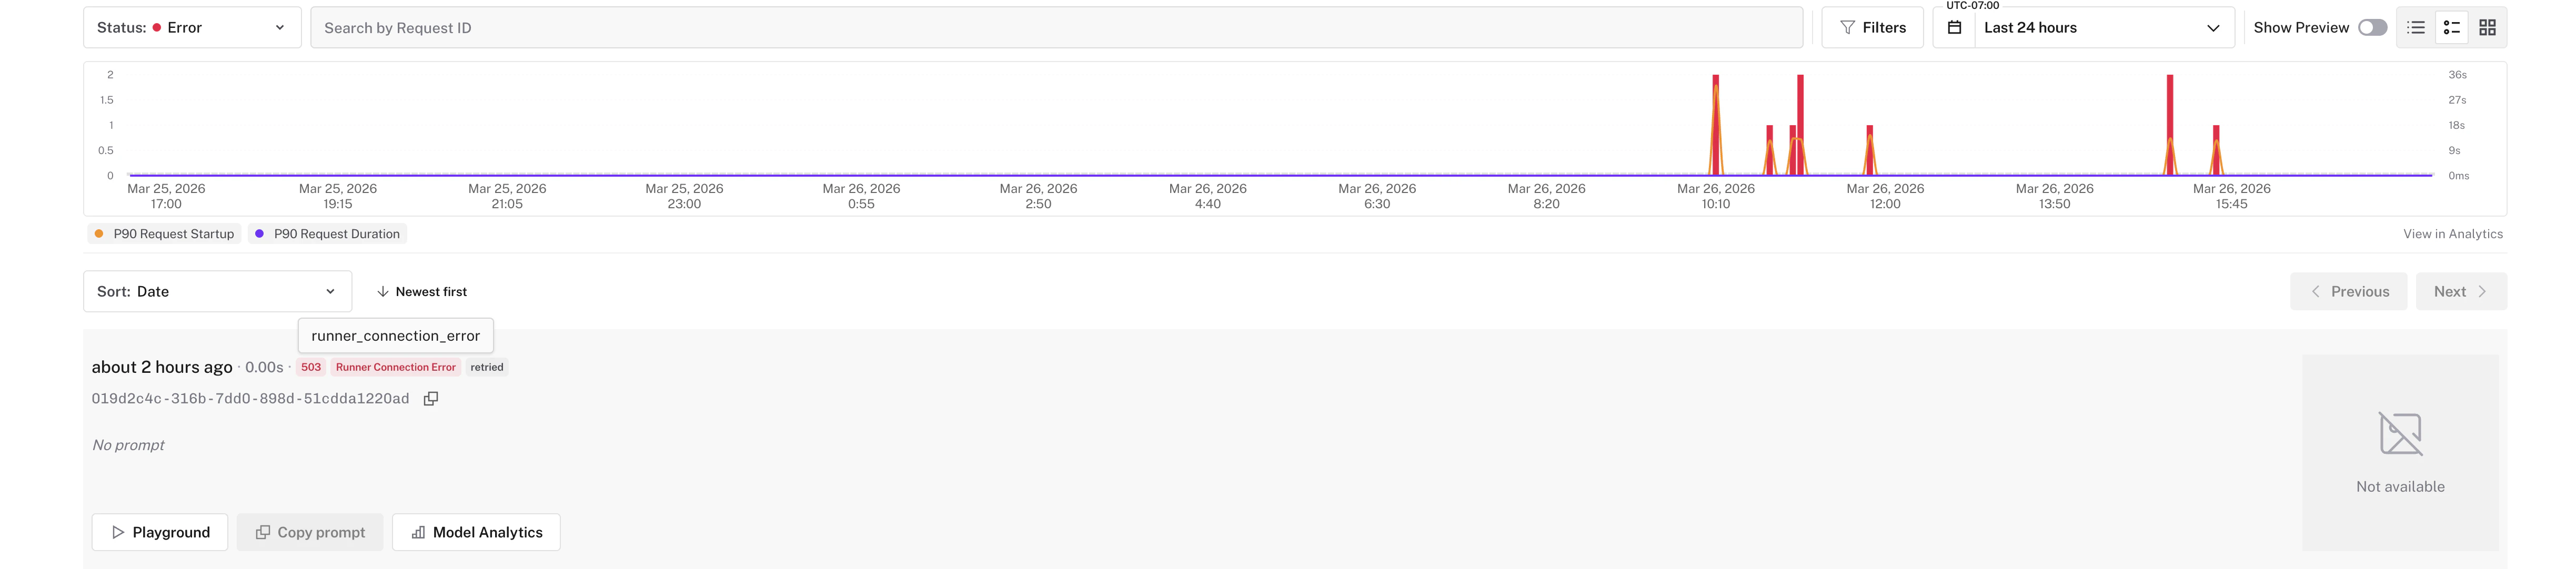
  * Failed requests in the dashboard now show the **specific reason** for the failure — not just a status code, but whether it was a `request_timeout`, `runner_disconnected`, `startup_timeout`, `runner_scheduling_failure`, and more
  * Instantly understand if a 500 was caused by your code crashing, the runner running out of memory, or a scheduling issue — without digging through logs
  * Error types are shown as badges on request rows and in the request detail view, matching the `error_type` field in [API responses](/model-apis/errors#request-error-types)
</Update>

<Update label="March 20, 2026" tags={["Dashboard", "Serverless"]}>
  ## Granularity Picker on App Overview Chart

  <Frame>
    <img src="https://mintcdn.com/fal-d8505a2e/o8eW4dsVeOWMw5el/images/changelog/granularity-picker.png?fit=max&auto=format&n=o8eW4dsVeOWMw5el&q=85&s=4caf1dec51215ceb44a02a7d5bfd48cb" alt="Granularity picker on the app overview chart" className="w-full rounded-lg" width="1910" height="874" data-path="images/changelog/granularity-picker.png" />
  </Frame>

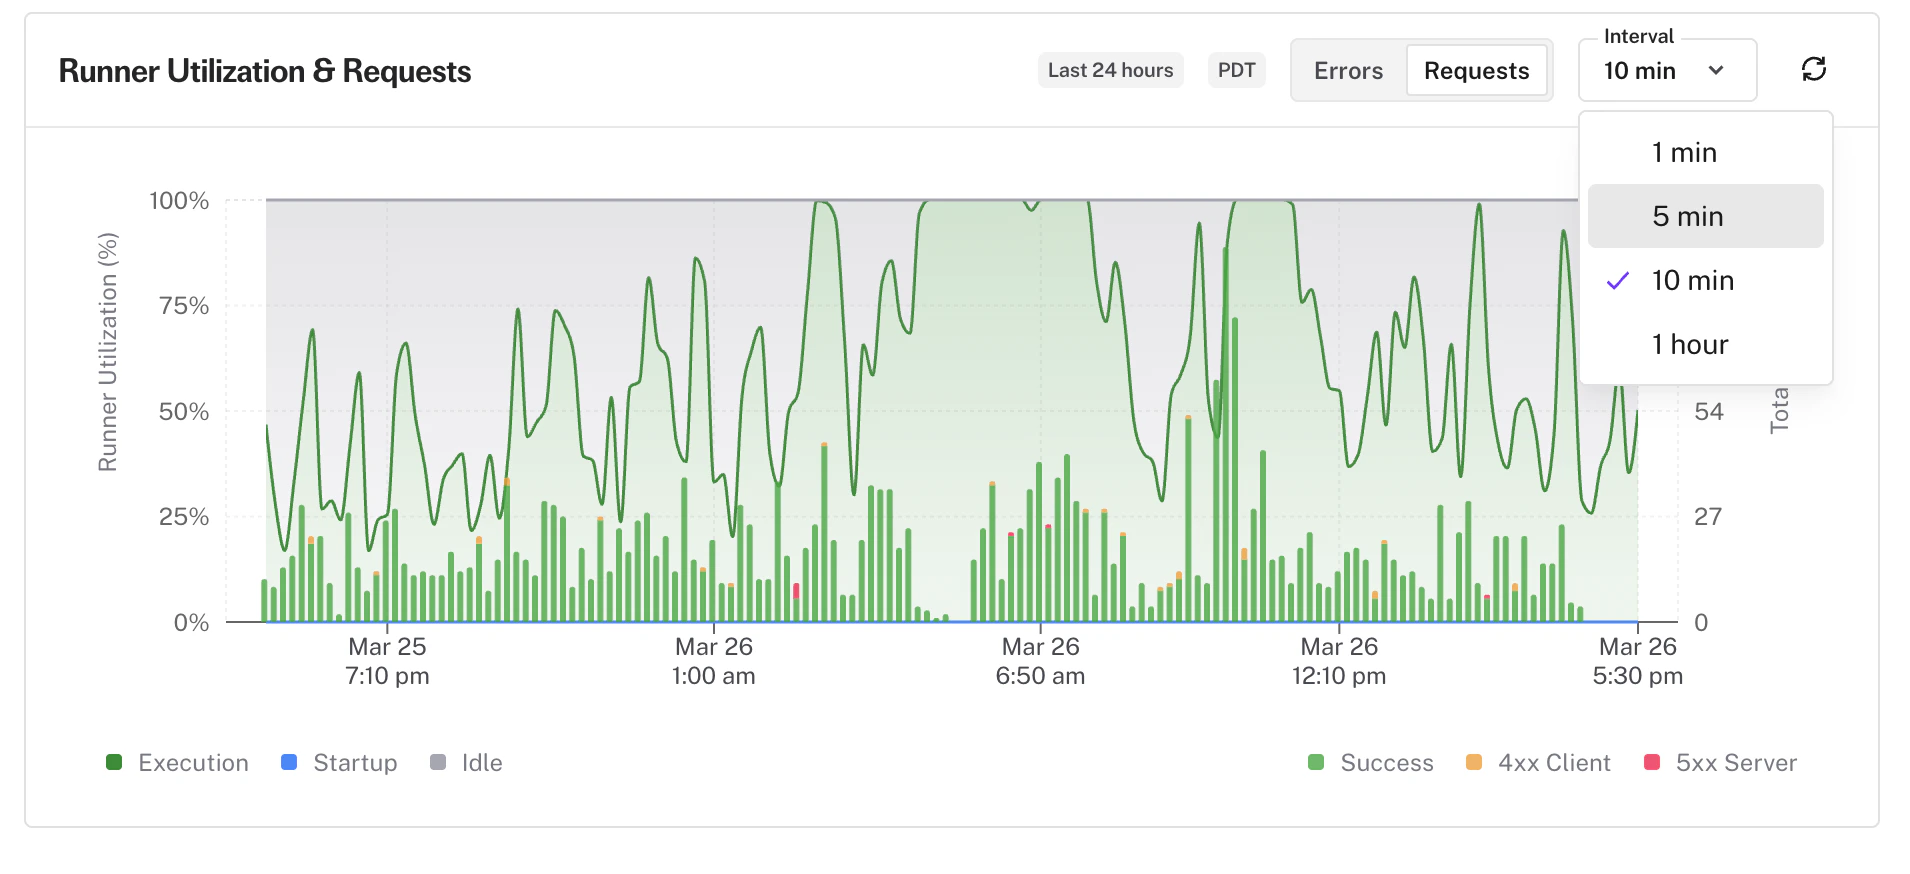
  * The app overview chart now includes a **granularity picker** to control the time bucket size — defaults to 10-minute intervals
  * Choose finer or coarser intervals to zoom into specific traffic patterns or view broader trends
</Update>

<Update label="March 16, 2026" tags={["Dashboard", "Serverless"]}>
  ## Enhanced App Cards

  * App cards on the listing page now show **separate client and server error rates** for clearer error attribution
  * Updated **machine type icons** for better visual identification of GPU types
  * Improved card layout with more readable stat values
</Update>

<Update label="March 20, 2026" tags={["Serverless"]}>
  ## REST API `/metrics` Improvements

  Runner-level resource metrics are now available through the REST API:

  * **Runner resource metrics** — CPU, memory, GPU, and VRAM usage are now included in `/metrics`, summed across all runners per app
  * **Per-runner metrics endpoint** — `GET /metrics/runners/{runner_id}` returns resource metrics for an individual runner
</Update>

<Update label="March 18, 2026" tags={["Platform"]}>
  ## fal MCP Server

  The fal MCP server is now available at `mcp.fal.ai`. Connect any AI assistant that supports the [Model Context Protocol](https://modelcontextprotocol.io) — Claude Code, Claude Desktop, Cursor, Windsurf, and more — to the full fal platform.

  **9 tools** let your assistant search 1,000+ models, check schemas and pricing, run inference, upload files, and browse documentation — all from a single conversation.

  ```bash theme={null}
  claude mcp add --transport http fal-ai \
    https://mcp.fal.ai/mcp \
    --header "Authorization: Bearer $FAL_KEY"
  ```

  The server is fully stateless and free to use. You only pay for the model runs you trigger.

  * [Setup guide](/documentation/setting-up/mcp)
</Update>

<Update label="March 17, 2026" tags={["Serverless"]}>
  ## `x-fal-stop-runner` Response Header

  You can now control whether a runner is terminated after a response using the `x-fal-stop-runner` response header, independent of the HTTP status code.

  * Set `x-fal-stop-runner: true` to force runner termination with any status code (same effect as a 503 on the runner, without requiring a 503 response)
  * Set `x-fal-stop-runner: false` to keep the runner alive even when returning a 503 (useful when you want the retry behavior of a 503 without killing the runner)
  * The header is stripped from the response before it reaches the caller
  * Combine with `X-Fal-Needs-Retry` to fully decouple retry behavior from runner lifecycle — for example, retry on a fresh runner (`X-Fal-Needs-Retry: 1` + `x-fal-stop-runner: true`) or retry while keeping the current runner alive (`X-Fal-Needs-Retry: 1` + `x-fal-stop-runner: false`)

  See [Retries and Error Handling](/documentation/serverless/reliability/retries#per-response-x-fal-stop-runner) for full details.
</Update>

<Update label="March 12, 2026" tags={["Dashboard", "Serverless"]}>
  ## Delete App Versions

  * You can now **delete individual app versions** directly from the dashboard
  * Useful for cleaning up old or failed deployments without needing the CLI
  * A confirmation dialog prevents accidental deletions
</Update>

<Update label="March 12, 2026" tags={["Dashboard", "Runners"]}>
  ## Shareable Runner Details

  * Runner slideout panels are now **shareable via URL** — click on a runner and copy the link to share the exact runner view with a teammate
  * Helpful for debugging runner issues collaboratively or linking from incident reports
</Update>

<Update label="March 12, 2026" tags={["Dashboard", "Serverless"]}>
  ## Endpoint Filter in Request Logs

  * Filter your request logs by **specific endpoint** to focus on traffic to a particular route (e.g. `/predict` vs `/health`)
  * Works alongside existing filters for status codes, date ranges, and apps
</Update>

<Update label="March 11, 2026" tags={["Dashboard", "Analytics", "Serverless"]}>
  ## Interval Selection and Chart Zoom in Analytics

  * The analytics pages now include an **Interval** picker that lets you control how metrics are bucketed — choose from **30 seconds**, **1 minute**, **5 minutes**, **10 minutes**, **1 hour**, **1 day**, **1 week**, or **1 month** depending on your selected date range
  * Use finer intervals (30 sec, 1 min) to pinpoint exact moments when latency spiked or error rates changed, and wider intervals (1 day, 1 week) for high-level trends over longer periods
  * **Click and drag on any chart** in [App Analytics](/documentation/serverless/observability/app-analytics) to select a time range and instantly zoom into that window — the date range updates automatically so you can isolate an incident, compare before-and-after a deployment, or drill into a traffic spike without manually adjusting date pickers
  * The Interval picker is available on both the **Requests** and **Runners** tabs in App Analytics, as well as in [Error Analytics](/serverless/observability/error-analytics)
</Update>

<Update label="March 11, 2026" tags={["Dashboard", "Serverless"]}>
  ## App List View

  * Toggle between **card view** and a new compact **list view** on the app listing page using the view switcher in the toolbar
  * List view displays your apps as rows with columns for **type**, **runners**, **requests/min**, **latency**, **errors**, **machine type**, and **last updated** — making it easy to scan and compare performance across many apps at once
  * Your view preference is saved automatically, so you'll see the same layout next time you visit
  * Especially useful for teams managing dozens of serverless apps who need to quickly spot which apps need attention
</Update>

<Update label="March 11, 2026" tags={["Serverless", "Model APIs"]}>
  ## Error Types in API Responses

  * Error responses now include a machine-readable **`error_type`** field identifying the specific failure category — such as `request_timeout`, `runner_disconnected`, `runner_scheduling_failure`, or `runner_server_error`
  * Use `error_type` to build smarter retry logic: runner and timeout errors (e.g. `runner_connection_timeout`, `startup_timeout`) are typically transient and worth retrying, while client errors like `bad_request` should not be
  * Track `error_type` values in your monitoring to spot trends — for example, frequent `runner_scheduling_failure` errors may indicate you need to increase `max_concurrency`

  See [Error Reference — Request Error Types](/model-apis/errors#request-error-types) for the full list of error types, status codes, and handling guidance.
</Update>

<Update label="March 11, 2026" tags={["Serverless", "Runners"]}>
  ## Termination Grace Period

  * New `termination_grace_period_seconds` parameter lets you control how long a runner has to finish in-flight requests and run `teardown()` before being forcefully killed
  * Defaults to **5 seconds**, configurable up to a maximum of **30 seconds**

  ```python theme={null}
  class MyApp(fal.App):
      termination_grace_period_seconds = 20
  ```

  See [Scale Your Application — Termination Grace Period](/serverless/deployment-operations/scale-your-application#termination-grace-period) for the full shutdown lifecycle and best practices.
</Update>

<Update label="February 25, 2026" tags={["Dashboard", "Serverless"]}>
  ## App Tagging

  * You can now create and assign **custom tags** to your serverless apps directly from the dashboard
  * Organize your app listing by tagging apps by team, project, model type, or any label that makes sense for your workflow
  * **Filter by tag** in the app list to quickly find the apps you need
  * Create, assign, and remove tags right from the app listing page — no CLI or API needed

  Tags are visual labels for organizing your dashboard — they don't affect app behavior, routing, or secrets. For isolated deployment stages (dev, staging, production), use [Environments](/serverless/deployment-operations/manage-environments) instead.
</Update>

<Update label="February 23, 2026" tags={["CLI", "Serverless"]}>
  ## Machine Type in Runner Output

  * `fal runners list` and `fal app runners <app>` now display the **machine type** for each runner (e.g. `GPU-A100`, `GPU-H100`)
  * JSON output (`--output json`) also includes the `machine_type` field for each runner
</Update>

<Update label="February 17, 2026" tags={["Serverless"]}>
  ## Runner `FAILURE_DELAY` Status

  * Runners that fail during `setup()` now show a `FAILURE_DELAY` status, making it easier to identify runners that are in a cooldown period before retrying initialization
  * You can filter runners by this state using `fal runners list --state failure_delay`
  * See [Understanding Runners](/serverless/deployment-operations/understand-runners#runner-states) for details
</Update>

<Update label="February 16, 2026" tags={["Dashboard", "Logs", "Serverless"]}>
  ## Interactive Log Histogram

  * The logs page now features an interactive histogram that visualizes log volume over time, broken down by severity level
  * **Click and drag** to select a time range on the histogram to zoom into that window and filter your logs instantly
  * **Zoom in and out** to explore log patterns at different time granularities
  * Color-coded bars show the distribution of stderr, error, warning, info, and trace logs at a glance

  ## Jump to Context

  * When viewing a specific log entry, use the new **Jump to Context** button to instantly scroll to surrounding log lines
  * Quickly see what happened before and after any log entry without manually searching through timestamps
  * Especially useful when navigating to a log from a shared link or alert

  ## Switch Log Timezones Between UTC and Local

  * You can now toggle between **UTC** and your **local timezone** directly from the datepicker in the logs page
  * All log timestamps, filters, and the histogram update instantly when switching timezones
</Update>

<Update label="February 12, 2026" tags={["Dashboard", "Platform", "Serverless"]}>
  ## Serverless App Cards with Error Rates and Graphs

  * The app listing page now displays rich cards for each serverless app with at-a-glance performance metrics
  * **Error rate indicators** show the health of each app directly on the card
  * **Inline sparkline graphs** visualize request volume and error trends over time
  * Quickly identify apps that need attention without clicking into each one individually
</Update>

<Update label="February 11, 2026" tags={["Dashboard", "Platform", "Serverless", "Logs"]}>
  ## Share Logs with Your Team

  * You can now click on any log entry and share the link directly with the rest of your team
  * Shared log links preserve the full context of the log, making it easy to collaborate on debugging and troubleshooting

  ## Runner Side Sheet

  * Click into any runner on the Runners page to open a detailed side sheet with telemetry, logs, and the ability to connect to the runner
  * Makes it much easier to debug and observe your runners without leaving the page
</Update>

<Update label="February 11, 2026" tags={["Serverless", "CLI"]}>
  ## `--auth` flag for `fal run`

  You can now specify the authentication mode when running your app with `fal run` using the `--auth` flag. Supported values are `public` and `private`, giving you control over who can access your app during development and testing.

  ```bash theme={null}
  fal run path/to/myapp.py::MyApp --auth private
  ```

  * `public` — no authentication required, app owner pays
  * `private` — only you or your team can access
</Update>

<Update label="February 4, 2026" tags={["Dashboard", "Logs"]}>
  ## Full-Screen Logs

  * The logs page now opens in a **full-screen view**, giving you significantly more vertical and horizontal space to work with
  * See more log lines at once and reduce scrolling when debugging complex issues
</Update>

<Update label="February 3, 2026" tags={["Serverless"]}>
  ## FalBaseModel for better input/output definitions

  Define your API inputs and outputs with `FalBaseModel` a Pydantic base class with built-in support for hidden fields, field ordering, and media type hints.

  * **Hidden fields** - Use `Hidden(Field(...))` to mark parameters as API-only, hiding them from the playground UI while keeping them accessible via API
  * **Field ordering** - Control the order of fields in your API schema with `FIELD_ORDERS`
  * **Media field helpers** - Use `ImageField`, `AudioField`, `VideoField`, and `FileField` for better playground rendering

  Example:

  ```python theme={null}
  from fal.toolkit import FalBaseModel, Field, Hidden, ImageField

  class TextToImageInput(FalBaseModel):
      FIELD_ORDERS = ["prompt", "negative_prompt", "image_size"]

      prompt: str = Field(description="Text description of the image")
      negative_prompt: str = Field(default="", description="What to avoid")
      image_size: str = Field(default="1024x1024")

      # Hidden from playground but accessible via API
      debug_mode: bool = Hidden(Field(default=False))
      internal_seed: int = Hidden(Field(default=-1))

  class ImageToImageInput(FalBaseModel):
      image_url: str = ImageField(description="Input image")
      strength: float = Field(default=0.8)
  ```

  See [Handle Inputs and Outputs](/serverless/development/handle-inputs-and-outputs#falbasemodel) for details.
</Update>

<Update label="February 2, 2026" tags={["Dashboard", "Serverless"]}>
  ## Switch environments from app pages

  You can now quickly switch between environments directly from any app page using the new environment dropdown in the dashboard.

  * **Environment dropdown** - Click the environment badge on any app page to see all environments where the app is deployed
  * **One-click switching** - Select an environment to navigate to the same app in that environment
  * **Quick access** - View environment secrets or create new environments directly from the dropdown
</Update>

<Update label="January 30, 2026" tags={["Serverless", "Runners", "Breaking Change"]}>
  ## Track when runners are idle and waiting for work

  <Warning>
    **Potential Breaking Change** - The runner state model has been updated. If
    you're monitoring or tracking runner states programmatically, you may need to
    update your integration to handle the new IDLE state.
  </Warning>

  Understand runner utilization with the new IDLE state that shows when runners are ready but not actively processing requests.

  * **IDLE state visibility** - see when runners finish processing and are waiting for new work
  * **Better resource monitoring** - distinguish between actively processing requests and waiting states
  * **Improved observability** - track idle time to optimize scaling and resource allocation

  See the new [Understanding Runners](/serverless/deployment-operations/understand-runners) guide and [Optimizing Cold Starts](/serverless/deployment-operations/optimize-cold-starts) guide for complete details on runner lifecycle, states, and performance optimization.
</Update>

<Update label="January 25, 2026" tags={["Model APIs"]}>
  ## Control queue wait time with `start_timeout`

  You can now set a `start_timeout` on requests which ensures that when queue time is too long, the request is aborted without starting.

  See [Client Libraries → Start Timeout](/model-apis/client#2-queue-management) for details.
</Update>

<Update label="January 21, 2026" tags={["Serverless"]}>
  ## Environments for isolated deployments

  Organize your applications, secrets, and configurations across different stages of your workflow with the new environments feature.

  * **Create isolated environments** for development, staging, and production
  * **Environment-scoped secrets** - use different API keys and credentials per environment
  * **Deploy to specific environments** using the `--env` flag

  ```bash theme={null}
  # Create a staging environment
  fal environments create staging

  # Deploy to staging
  fal deploy my_app.py --env staging

  # Set environment-specific secrets
  fal secrets set API_KEY=staging-key --env staging
  ```

  See [environments documentation](/serverless/deployment-operations/manage-environments) for details.
</Update>

<Update label="January 19, 2026" tags={["Serverless"]}>
  ## Handle graceful shutdown with `handle_exit()` and `teardown()`

  You can now define `handle_exit()` and `teardown()` methods in your app to handle graceful shutdown.

  * **`handle_exit()`** - Called when the runner is requested to terminate to signal handlers to stop early.
  * **`teardown()`** - Called when the runner is shutting down to clean up resources.

  See [lifespan docs](https://docs.fal.ai/serverless/getting-started/core-concepts#lifespan) for details.
</Update>

<Update label="January 13, 2026" tags={["Serverless"]}>
  ## Include local files in container builds with COPY and ADD

  <Warning>
    **Experimental Feature** - This feature is currently experimental.
  </Warning>

  You can now use standard Docker `COPY` and `ADD` commands to include local files in your container builds.

  * **Automatic file parsing** - fal parses your Dockerfile to find COPY/ADD commands and collects referenced files
  * **Hash-based deduplication** - Files are uploaded to fal's storage with content-addressable deduplication (files from `app_files` are reused automatically)
  * **.dockerignore support** - Create a `.dockerignore` file or use `add_dockerignore()` to exclude files
  * **Multi-stage build support** - `COPY --from=...` commands are correctly handled (only local files are collected)
  * **Smart rebuilds** - Changes to your `fal.App` file don't trigger rebuilds (it's pickled separately); only changes to COPY/ADD referenced files trigger rebuilds

  Example:

  ```python theme={null}
  dockerfile_str = """
  FROM python:3.11
  WORKDIR /app
  COPY requirements.txt .
  RUN pip install -r requirements.txt
  COPY src/ ./src/
  """

  class MyApp(fal.App):
      image = ContainerImage.from_dockerfile_str(dockerfile_str)
  ```

  See [custom container image docs](https://docs.fal.ai/serverless/development/use-custom-container-image#using-copy-and-add-commands).
</Update>

<Update label="January 9, 2026" tags={["Serverless"]}>
  ## Skip retries for specific conditions

  You can now skip retries for specific conditions using the `skip_retry_conditions` option.

  ```python theme={null}
  class MyApp(fal.App):
      skip_retry_conditions=["timeout"]  # This app won't retry on timeout
      ...
  ```

  Available conditions: `"server_error"`, `"timeout"`.

  See [retry policy docs](https://docs.fal.ai/serverless/getting-started/core-concepts#retry-policy) for details.
</Update>

<Update label="January 7, 2026" tags={["Serverless"]}>
  ## Graceful shutdown of fal apps

  Starting with `fal>=1.61.0`, runners now receive a `SIGTERM` signal when terminated and are given a **5-second grace period** to complete ongoing requests before being forcefully terminated with `SIGKILL`.

  This applies to all termination scenarios: expiration, manual stop/kill, and scaling down. Use the `teardown()` method to handle cleanup during this grace period.

  See [lifespan docs](https://docs.fal.ai/serverless/getting-started/core-concepts#lifespan) for details.
</Update>

<Update label="December 22, 2025" tags={["Serverless"]}>
  ## Add a health check endpoint to your application

  Add a health check endpoint to your application to automatically replace unhealthy runners.

  * **Health check endpoint** - Pass the `health_check` parameter to the `@fal.endpoint()` decorator to configure an endpoint as your health check
  * **Periodic checks and recovery** - fal periodically (every 15 seconds) calls this endpoint and replace unhealthy runners if it fails for a few consecutive calls

  Example:

  ```python theme={null}
  class MyApp(fal.App):
      @fal.endpoint("/health", health_check=fal.HealthCheck(failure_threshold=3))
      def health(self) -> HealthResponse:
          if not self.connection.is_alive():
              raise RuntimeError("Lost connection to the external service")
          return HealthResponse(status="ok")
  ```

  See [health check endpoint docs](https://docs.fal.ai/serverless/development/add-health-check-endpoint).
</Update>

<Update label="December 22, 2025" tags={["Serverless"]}>
  ## Disable environment build cache

  You can now disable the environment build cache
  by passing the `--no-cache` flag to the `fal deploy` or `fal run` command.

  See [custom container image docs](https://docs.fal.ai/serverless/development/use-custom-container-image#disable-build-cache).
</Update>

<Update label="November 25, 2025" tags={["Serverless"]}>
  ## Scale your application with the new scaling delay feature

  Scale your application with the new scaling delay feature.

  * **Scaling delay** - the amount of seconds the system will wait for a request to be picked up by a runner before triggering a scale up of a runner

  Example:

  ```python theme={null}
  class MyApp(fal.App):
      scaling_delay = 30
      # ...
  ```

  See [scaling docs](https://docs.fal.ai/serverless/deployment-operations/scale-your-application#scaling-delay).
</Update>

<Update label="November 17, 2025" tags={["Serverless"]}>
  ## Reduce cold start times with shared compiled PyTorch caches

  Dramatically reduce cold start times for torch.compile() models with the new inductor cache utilities.

  * **Load pre-compiled CUDA kernels** in \~2 seconds instead of recompiling for 20-30 seconds on each worker
  * **GPU-specific caching** automatically organized by GPU type (H100, H200, A100)
  * **Two usage patterns**: Manual control with `load_inductor_cache()` / `sync_inductor_cache()` or automatic with `synchronized_inductor_cache()` context manager
  * **Persistent shared storage** at `/data/inductor-caches/<GPU_TYPE>/<cache_key>.zip`
  * First worker compiles and shares, subsequent workers load instantly

  Example:

  ```python theme={null}
  from fal.toolkit import synchronized_inductor_cache

  with synchronized_inductor_cache("mymodel/v1"):
      self.model = torch.compile(self.model)
      self.warmup()  # Compilation happens once, synced automatically
  ```

  See [compilation cache docs](https://docs.fal.ai/serverless/optimizations/optimize-startup-with-compiled-caches).
</Update>

<Update label="November 14, 2025" tags={["Serverless", "Dashboard"]}>
  ## Get Slack notifications for serverless app failures

  Never miss critical issues with instant Slack alerts for your serverless applications.

  * **Connect your workspace** with one-click OAuth installation
  * **Choose notification channel** from a dropdown of your Slack channels
  * **Instant alerts for**:
    * App startup failures and timeouts
    * Critical platform issues
    * Real-time error notifications
  * **Team visibility** - everyone in the channel sees important updates
  * Configure at `https://fal.ai/dashboard/notifications/settings`
</Update>

<Update label="November 4, 2025" tags={["Serverless", "Dashboard", "Runners", "Logs"]}>
  ## Stop and kill runners directly from the dashboard

  No more switching to the CLI to manage your runners. You now have full lifecycle control right from the dashboard.

  * **Graceful shutdown** or **force kill** runners with a single click
  * Access at `https://fal.ai/dashboard/apps/{username}/{appname}/runners`

  ## Stream platform logs to your own endpoint with drains

  Integrate fal's logging with your existing observability stack using the new Serverless Drains feature.

  * **Automatic log forwarding** from apps, runners, and file operations in NDJSON format
  * Works with Datadog, Splunk, Elasticsearch, or any HTTP endpoint
  * Configure at `https://fal.ai/dashboard/drains`
</Update>

<Update label="November 2, 2025" tags={["CLI", "Files", "Serverless"]}>
  ## Upload larger files with improved timeout handling

  We've significantly improved the reliability of file uploads from URLs, especially for large datasets and model files.

  * **Extended timeout to 10 minutes** for `fal files upload` and `fal files upload-url`
  * Upload multi-GB files without timeout errors
  * See [`fal files` docs](https://docs.fal.ai/serverless/cli/files)
</Update>

<Update label="November 1, 2025" tags={["CLI", "Runners", "Serverless"]}>
  ## Restart all runners without redeploying

  Apply environment changes or recover from bad states instantly with the new `fal apps rollout` command.

  * **Restart all runners** for an app without creating a new deployment
  * **Graceful by default** (runners finish current requests) or use `--force` for immediate restart
  * Pick up new secrets, environment variables, or clear memory issues
  * See [`fal apps rollout` docs](https://docs.fal.ai/serverless/cli/apps/rollout)

  ## Stop specific runners without affecting others

  Target individual runners for maintenance with graceful shutdown via `fal runners stop`.

  * Stop specific runners without affecting others, useful for targeted maintenance
  * See [`fal runners` docs](https://docs.fal.ai/serverless/cli/runners)

  ## Debug production runners with interactive shell access

  Jump directly into any running container to troubleshoot issues in real-time with `fal runners shell`.

  * **SSH-like access** to inspect files, environment variables, and dependencies
  * Debug production issues without redeploying
  * See [`fal runners shell` docs](https://docs.fal.ai/serverless/cli/runners#shell)
</Update>

<Update label="October 31, 2025" tags={["Dashboard", "Serverless"]}>
  ## See everything happening in your app with the events timeline

  Complete activity history for runners, deployments, and config changes in one place.

  * **Unified timeline** of runner events, deployments, and config changes
  * Access at `https://fal.ai/dashboard/apps/{username}/{appname}/events`
</Update>

<Update label="October 25, 2025" tags={["Dashboard", "Serverless", "Onboarding"]}>
  ## Get from zero to deployed in minutes with in-app onboarding

  New interactive guide walks you through your first serverless deployment step-by-step.

  * **Step-by-step walkthrough** from installation to deployment with copy-paste examples
  * Access at `https://fal.ai/dashboard/serverless-get-started`
</Update>

<Update label="October 22, 2025" tags={["CLI", "Files"]}>
  ## Delete files from fal storage

  Remove files and directories with the new `fal files rm` command.

  * **Recursive deletion**: `fal files rm path/to/file-or-directory`
  * See [`fal files` docs](https://docs.fal.ai/serverless/cli/files)
</Update>

<Update label="October 21, 2025" tags={["Platform API", "Models API", "Analytics", "Serverless"]}>
  ## Platform APIs v1 officially released

  Programmatically manage your model deployments with the new Platform APIs.

  * **Model discovery** - search and metadata retrieval for 600+ models
  * **Pricing and cost estimation** - real-time pricing information
  * **Usage tracking** - detailed line items with quantities and prices
  * **Analytics** - request counts, error rates, and latency percentiles
  * Available at `https://api.fal.ai/v1` - see [docs](https://docs.fal.ai/platform-apis)

  ## Get notified when you hit concurrent requests limits

  Never wonder why requests are queuing—we now send notifications when you reach your concurrency limit.

  * **Email and dashboard notifications** with smart throttling (immediate, 1h, 1d, weekly)
  * **Limit value included** in 429 responses for programmatic handling

  ## Debug errors faster with the new errors page

  Comprehensive error analytics to identify and resolve issues quickly.

  * **Server vs client error rates** with 4xx/5xx breakdown and sparklines
  * **Error timeline** with status code distribution and endpoint-level breakdown
  * Access at `https://fal.ai/dashboard/apps/{username}/{appname}/errors`
</Update>

<Update label="October 20, 2025" tags={["CLI", "Runners", "Serverless"]}>
  ## Stop or kill individual runners from the command line

  Precise control over each runner's lifecycle without touching the dashboard.

  * **`fal runners stop`** - gracefully stop a runner, allowing in-flight requests to complete
  * **`fal runners kill`** - immediately terminate a runner without waiting
  * See [`fal runners` docs](https://docs.fal.ai/serverless/cli/runners)
</Update>

<Update label="October 16, 2025" tags={["Dashboard", "Serverless", "CLI"]}>
  ## See exactly how long runners spend starting up

  Identify GPU availability bottlenecks and optimize cold start times.

  * **Pending uptime metrics** show how long runners wait before becoming active
  * Track PENDING, DOCKER\_PULL, and SETUP state durations separately
</Update>

<Update label="October 15, 2025" tags={["Serverless", "MCP", "Models API"]}>
  ## Connect fal docs to Cursor with MCP

  Access the complete fal documentation directly in Cursor using Model Context Protocol.

  * **Complete documentation in your IDE** with AI-powered suggestions
  * Simple setup: add fal MCP server to your `mcp.json` - see [guide](https://docs.fal.ai/model-apis/mcp)

  ## Personalized dashboard with creator and developer views

  The dashboard now adapts to your workflow with two distinct experiences.

  * **Creator view** - gallery-focused with favorite models and visual generation history
  * **Developer view** - metrics-driven with usage stats, error tracking, and API analytics
  * **Quick stats** showing credits, requests, and errors with sparklines
</Update>

<Update label="October 13, 2025" tags={["Serverless", "Models API", "Multi-GPU"]}>
  ## Add custom headers to your API requests

  Integrate seamlessly with analytics, auth, and middleware by passing custom HTTP headers.

  * Add custom headers for analytics, authentication, or middleware integration
  * Works with all client libraries

  ## Multi-GPU inference and training with fal.distributed

  Scale AI workloads across multiple GPUs with the new `fal.distributed` module.

  * **Data parallelism** - generate multiple outputs simultaneously (e.g., 4 images on 4 GPUs)
  * **Model parallelism** - split large models across GPUs for faster generation
  * **Distributed training** - synchronized gradient updates with DDP
  * Supports 2, 4, or 8 GPU configurations on H100s and A100s
  * See [distributed docs](https://docs.fal.ai/serverless/distributed/overview)
</Update>

<Update label="October 10, 2025" tags={["Dashboard", "Serverless"]}>
  ## Dedicated pages for Analytics, Runners, Logs, and Versions

  Complete app details redesign gives each deployment aspect its own focused view.

  * **New Analytics page** - runner-focused metrics with date range filtering
  * **New Runners page** - app-scoped runner view with enhanced filters
  * **New Logs page** - dedicated log viewer for debugging
  * **New Versions page** - manage and view app revisions
  * **Enhanced Overview** - endpoint stats and performance metrics at a glance
</Update>

<Update label="October 9, 2025" tags={["Product"]}>
  ## Compare models side-by-side in the new Sandbox

  Find the perfect model by testing multiple options in parallel with the same prompt.

  * Run multiple models simultaneously with the same prompt
  * Available at `https://fal.ai/sandbox`
</Update>

<Update label="October 8, 2025" tags={["Serverless"]}>
  ## Manage deployments from Python without async/await

  New synchronous client makes serverless management feel just like the CLI.

  * Manage apps, runners, and deployments programmatically without async/await
  * Same API as CLI: `client.apps.*`, `client.runners.*`, `client.deploy()`
  * See [Python client docs](https://docs.fal.ai/serverless/python/client)
</Update>

<Update label="October 6, 2025" tags={["Serverless"]}>
  ## Bring your own container to any deployment

  Full control over your runtime environment with custom Docker images.

  * Use `ContainerImage.from_dockerfile_str()` or `ContainerImage.from_dockerfile()`
  * Install any dependencies, tools, or system packages you need
  * See [custom containers guide](https://docs.fal.ai/serverless/development/use-custom-container-image)
</Update>

<Update label="October 3, 2025" tags={["Serverless", "CLI", "Dashboard", "Files"]}>
  ## Dynamic auto-scaling with percentage-based buffers

  Scale more intelligently by setting concurrency buffers as percentages instead of fixed numbers.

  * Configure buffer as a percentage of current concurrency for dynamic scaling
  * See [scaling docs](https://docs.fal.ai/serverless/deployment-operations/scale-your-application)

  ## Runner logs with streaming and filtering

  Real-time log streaming and powerful filtering for faster debugging.

  * **Stream logs in real-time** with `fal runners logs --follow`
  * **Filter by time range** with `--since` and `--until`
  * **Search logs** with `--search` parameter
  * **Scrollable and searchable** in the dashboard with SSE-powered updates
  * See [`fal runners logs` docs](https://docs.fal.ai/serverless/cli/runners#logs)

  ## Include local files in your deployments automatically

  Bring configs, utilities, and code from your local machine into serverless apps.

  * Specify files with relative or absolute paths to include at runtime
  * Works with `fal run` and `fal deploy`
  * See [app files docs](https://docs.fal.ai/serverless/development/app-files)

  ## Find what you need faster with reorganized navigation

  Clearer dashboard structure groups features by workflow: Generate, Serverless, and Manage.

  * **Generate** group: Sandbox, Model Gallery
  * **Serverless** group: Apps, Logs, Files, Runners
  * **Manage** group: Usage, Billing, API Keys, Webhooks, Team Members
</Update>

<Update label="October 2, 2025" tags={["Dashboard", "Runners", "CLI"]}>
  ## Know exactly which version each runner is running

  Track deployments better with revision IDs shown on every runner.

  * **Revision ID displayed** on runners to track which version is running
  * **State renamed**: "DEAD" → "TERMINATED" for clarity
</Update>

<Update label="October 1, 2025" tags={["Logs", "Dashboard", "CLI", "Serverless"]}>
  ## Filter logs with custom labels and powerful queries

  Find what you need instantly with EXACT/CONTAINS matching and multi-condition filters.

  * **EXACT or CONTAINS** matching for label values
  * **Multiple conditions** with OR logic (e.g., `status IN ["error", "warning"]`)
  * Available in dashboard and API
  * Examples: `error_type = "ValidationError"`, `endpoint CONTAINS "/api/v2/"`

  ## See what runners are doing during startup

  Track exactly where runners are in the startup process—pending, pulling images, or setting up.

  * `fal runners list` now shows PENDING, DOCKER\_PULL, and SETUP states
  * Understand deployment progress in real-time

  ## View all app endpoints and config at a glance

  Redesigned app details page surfaces the information you need most.

  * Endpoints, configuration, and status all in one place
</Update>

<Update label="September 27, 2025" tags={["CLI", "Serverless"]}>
  ## Monitor and clear your request queue from the CLI

  Check how many requests are queued and flush them when needed.

  * `fal queue size app_name` - check queue size for an app
  * `fal queue flush app_name` - flush all pending requests
  * See [`fal queue` docs](https://docs.fal.ai/serverless/cli/queue)
</Update>

<Update label="September 10, 2025" tags={["CLI", "Runners", "Serverless"]}>
  ## View runner history with time-based filtering

  See terminated runners and filter by state to debug failures.

  * `fal runners list --since "1h"` - view runners from the last hour (max 24h)
  * `fal runners list --state dead` - filter by state (running, pending, setup, dead)
  * Helpful for debugging failed deployments and understanding runner lifecycle
  * See [`fal runners list` docs](https://docs.fal.ai/serverless/cli/runners#list)
</Update>

<Update label="August 29, 2025" tags={["CLI", "Files", "Serverless"]}>
  ## Reorganize files in fal storage without re-uploading

  Move and rename files instantly with the new `fal files mv` command.

  * Rename or move files in fal storage: `fal files mv source destination`
  * See [`fal files` docs](https://docs.fal.ai/serverless/cli/files)
</Update>

<Update label="August 26, 2025" tags={["CLI", "Serverless"]}>
  ## See all your endpoint URLs immediately when testing

  No more guessing which URL to use—CLI shows playground, sync, and async routes for every run.

  * CLI prints playground, synchronous, and asynchronous routes for `fal run`
</Update>